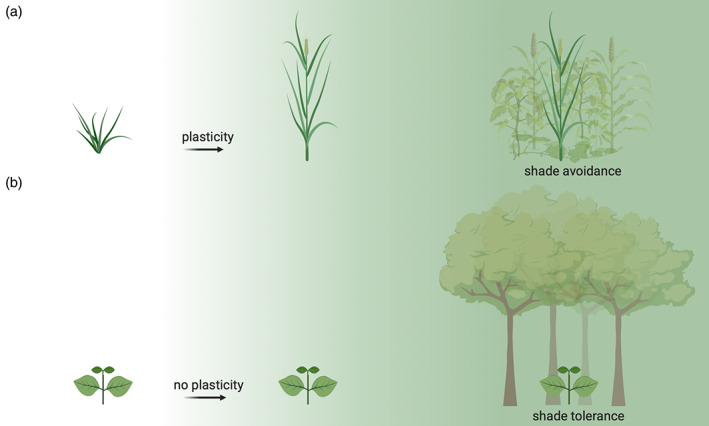
FIGURE 4.

Phenotypic plasticity for density‐associated shade cues. (a) Plants able to respond to increasing neighbour density show plastic SAS responses in contrast to (b) plants that are not responding to density signals and therefore not showing plastic changes in their phenotype. SAS responses are adaptive in competitive fields with approximately equally sized individuals (a). Shade avoidance is typically suppressed in forest understory plants that cannot outgrow the much larger trees around them (b) and here shade tolerance then becomes the adaptive trait. Created with BioRender.com [Colour figure can be viewed at wileyonlinelibrary.com]
