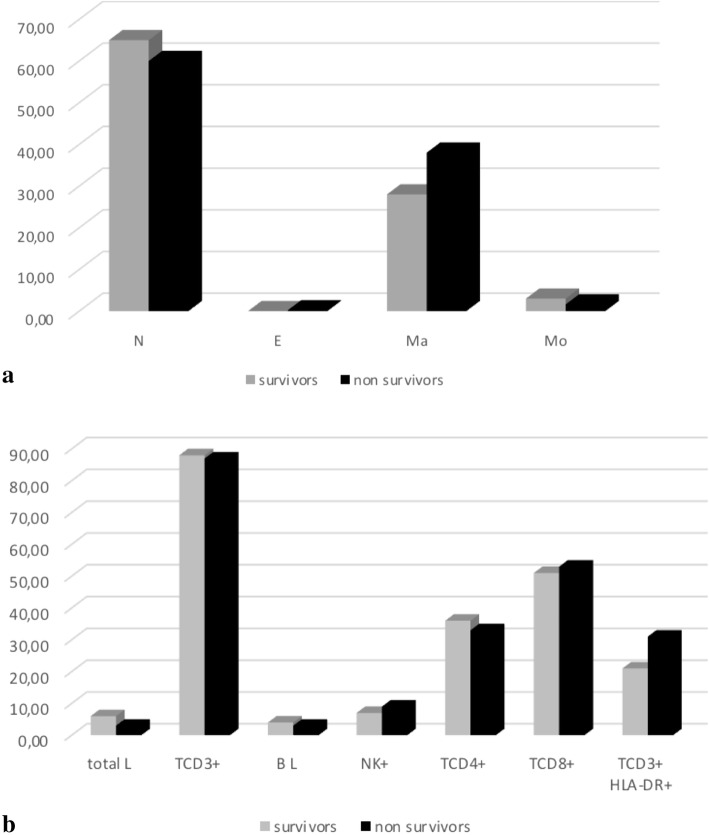
Fig. 1.
The comparison of percentage of different types of cells in bronchoalveolar lavage fluid in survivors and non-survivors. a (neutrophils, eosinophils, macrophages, monocytes). The survivors are represented in grey and non-survivors in black. All values are expressed as percentage. N: neutrophils, E: eosinophils, Ma: macrophages, Mo: monocytes. b (total lymphocytes, T CD3+, B, natural killer, T CD4+, TCD8+ and TCD3 + HLA-DR+). The survivors are represented in grey and non-survivors in black. All values are expressed as percentage. L: lymphocytes, TCD3+: lymphocytes T CD3+, B L: B lymphocytes, NK+: natural killer cells, TCD4+: lymphocytes TCD4+, TCD8+: lymphocytes TCD8+, TCD3 + HLA-DR+: activated lymphocytes. In the bronchoalveolar lavage fluid of non-survivors, the median value of macrophage percentages was higher (35%) than in survivors (20%); the TCD4+/TCD8+ ratio was lower (0.5 vs 0.6), and activated lymphocytes (TCD3 + HLA-DR+) were higher in the non-survivors (23% vs 20%) compared to survivors. All the differences are not statistically significant

