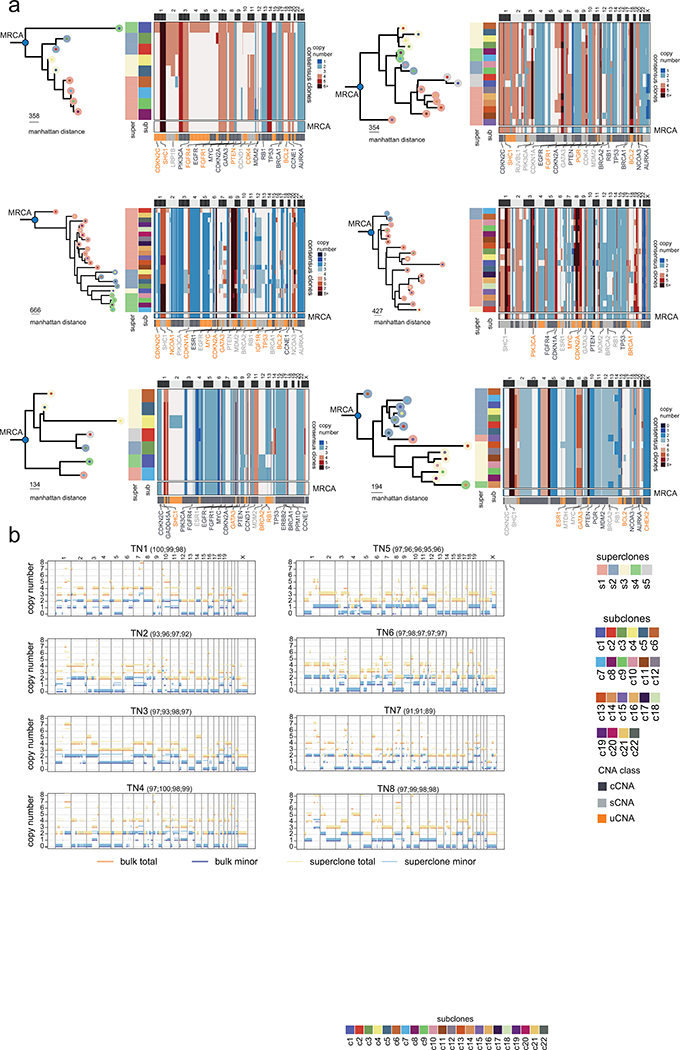
Extended Data Figure 6 -. Evolutionary Analysis of Clonal Lineages in additional TNBC Patients.
(a) Left panels show the minimum evolution trees after the MRCA generated using the consensus CNA profiles of subclones for TN3 – TN8 rooted by a neutral node to the MRCA and colored by superclones and subclones. Right panels show heatmaps of consensus subclones profiles, with annotations for the superclones and subclones on left annotation bars and bottom annotation bars showing different CNA classes, as well as selected breast cancer genes. The last row in the clustered heatmaps shows the inferred MRCA copy number profiles. (b) Genome-wide copy-number profiles of TNBC tumors with segments of the rounded total copy-number (orange) and the rounded number of copies of the minor allele (blue). Thick segments are ASCAT profiles from the exome bulk, while thinner segments are from the superclones with slight offset relative to integer values for visualization. For each superclone, in parentheses the percentage of the genomic region where both the minor and major allele copy numbers are the same as in the exome are shown, restricting to the genomic region where the total is also the same.

