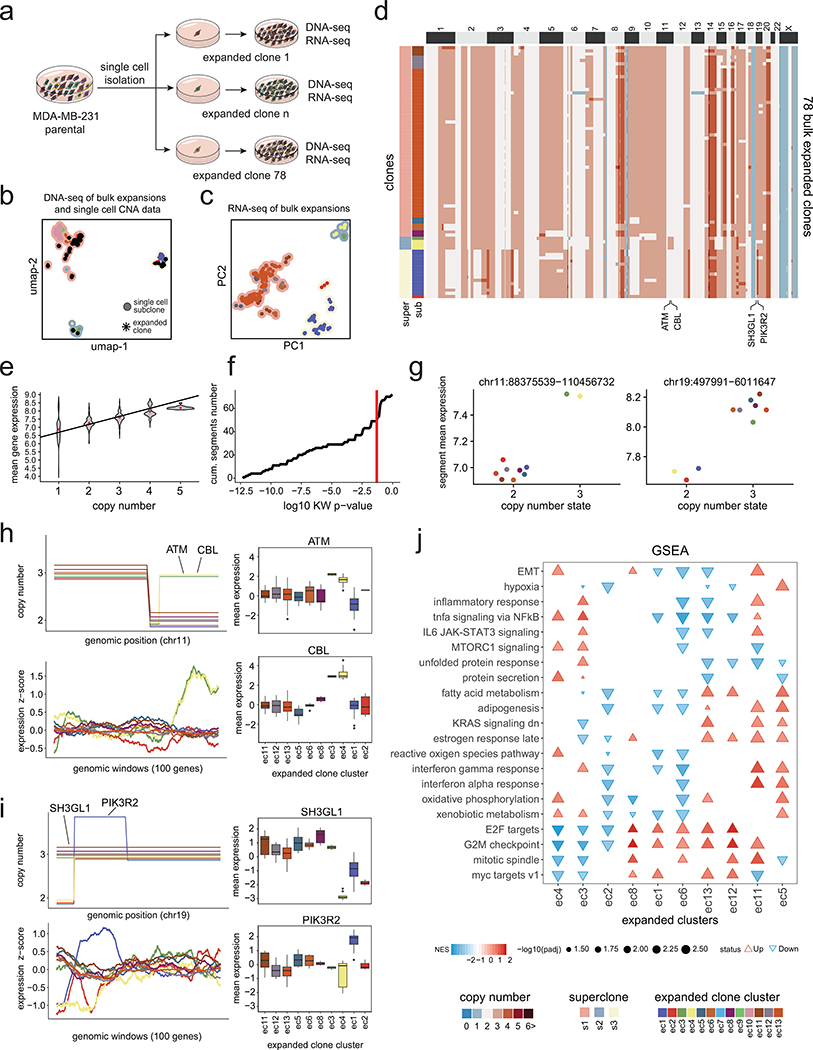
Extended Data Figure 9 – DNA and RNA Analysis of Expanded Clones from MDA-MB-231.
(a) Schematic of physical single cell subcloning experiments of daughter cells to generate 78 expansions from the MDA-MB-231 parental cell line. (b) Co-clustering of the single cell copy number data from the parental MDA-MB-231 cell line (n = 820 cells) with the 78 expanded clone bulk DNA-seq copy number profiles. (c) PCA of bulk RNA-seq profiles of the 78 expanded daughter cell lines triplicates, with contour colors representing superclones and point color representing the subclone clusters from the genotypes of the single-cell and bulk DNA-Seq co-clustering. (d) Clustered heatmap of bulk DNA copy number profiles from the 78 expanded clones, with left annotation bars representing superclones and subclones, as determined by co-clustering with the parental single cell copy number data. (e) Mean gene expression levels of different copy number states for 78 expansions from the MDA-MB-231 parental cell line. (f) Cumulative number of subclonal segments as a function of Kruskal-Wallis test p-value, in which the red line denotes a p-value of 0.05. (g) Mean gene expression as a function of copy number segments with points representing expanded clusters for two subclonal CNAs on chr11 and chr19. (h-i) Consensus integer copy number profiles of the 10 expanded clone clusters on chromosome 11 (h) and chromosome 19 (i) shown in the upper panels with matched RNA-seq expression below using moving windows of 100 genes. Right panels show selected breast cancer genes in subclonal CNA regions and their corresponding box plots of RNA expression for each expanded cluster. (j) Cancer hallmark signatures with significant variability of normalized enrichment scores (NES) across the expanded clone clusters.

