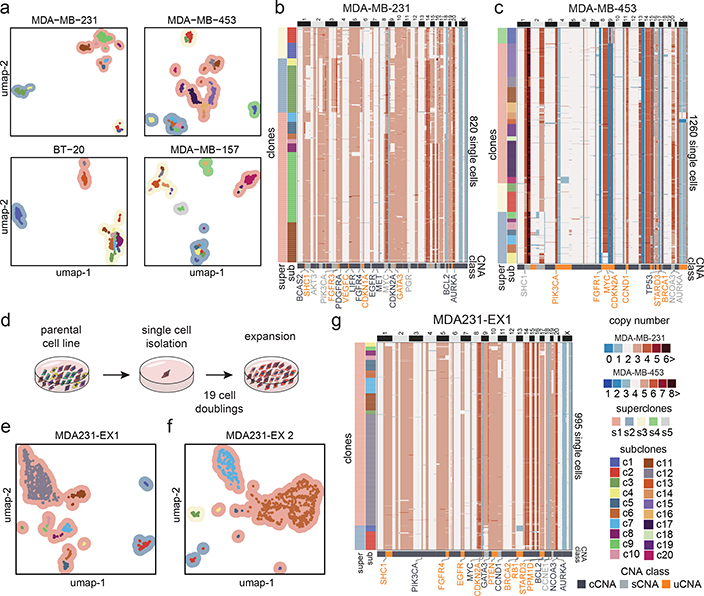
Figure 5 – Clonal Substructure of TNBC Cell Lines and Single Cell Expansions.
(a) UMAP and clustering of single cell copy number data from four TNBC cell lines, including MDA-MB-231 (n = 820 cells), MDA-MB-453 (n = 1260 cells), BT-20 (n = 1231 cells) and MDA-MB-157 (n = 1210 cells), in which contour colors represent superclones and colored points represent subclones. (b-c) Clustered heatmaps of ACT data from the MDA-MB-231 and MDA-MB-453 cell lines (d) Schematic of subcloning experiments for expanding single daughter cells from the parental MDA-MB-231 cell line. (e-f) High-dimensional UMAP clustering of single cell copy number data from two expanded daughter cell populations after 20 cell doublings. (g) Clustered heatmaps of ACT data from the EX1 expanded cells from MDA-MB-231, with CNA classes indicated below.

