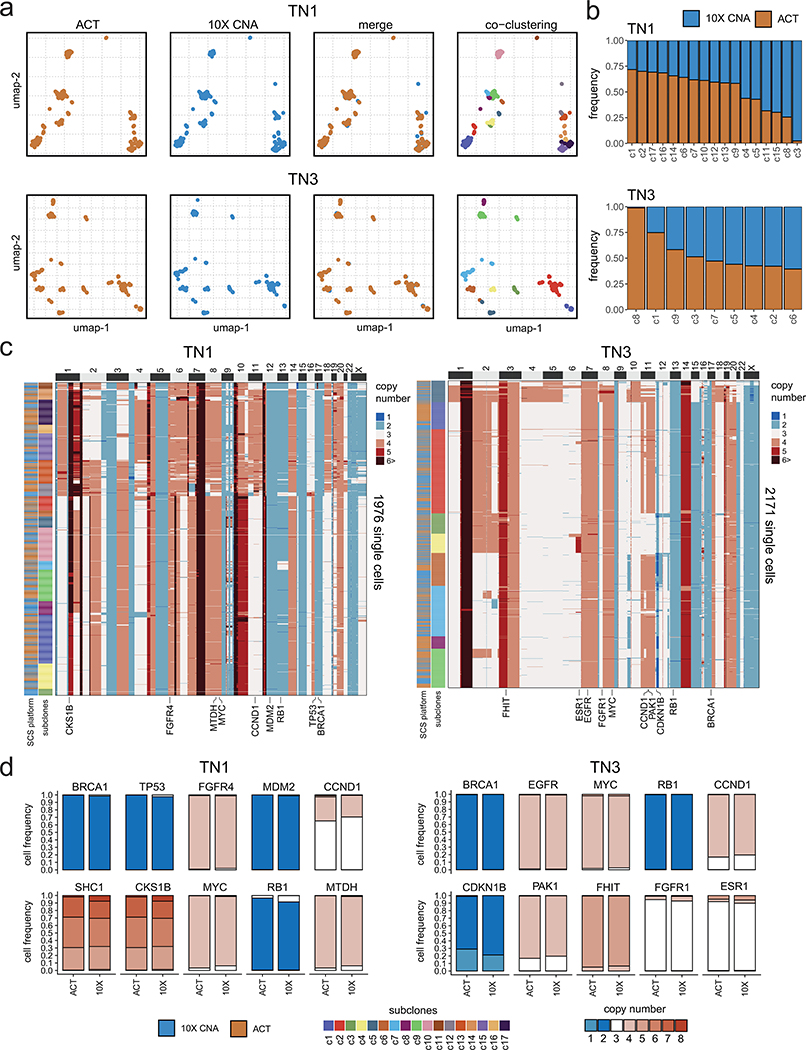
Extended Data Figure 4 – Validation of Clonal Substructure Using a Microdroplet Approach.
(a) Co-clustering of ACT and 10X Genomics copy number data for samples TN1 (n = 1976 cells) and TN3 (n = 2171 cells), showing subclones detected in the merged data sets. (b) Frequency of subclones detected on each platform in the merged datasets from 10X and ACT. (c) Clustered heatmaps of single cell copy number profiles for TN1 and TN3 with left annotation bars representing the scDNA-seq technology platform and the different subclones, with annotations for selected breast cancer genes indicated below (d) Barplots of copy number state frequencies of selected breast cancer genes for ACT and 10X CNV showing the proportion of copy number states for all cells separated by platform.

