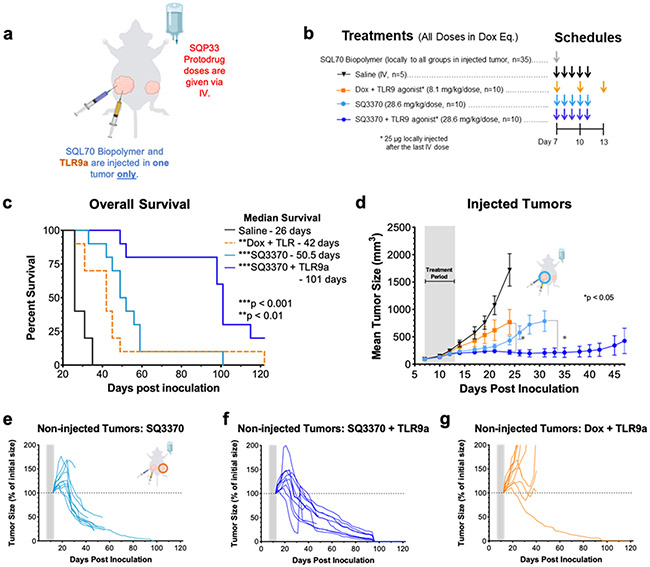
Figure 5 – SQ3370 treatment with TLR9a— Tumor Growth and Overall Survival in Dual-Tumor Mice.
a) Treatment schematic for a syngeneic MC38 dual tumor study in immunocompetent C56BL/6 mice. All tumor cells were implanted at Day 0. b) Treatments started at Day 7 with local injection of biopolymer at the primary “injected” tumor, followed by systemic therapies and a local injection of 25 ug TLR9a at the “injected” tumor after the last IV dose. c) Kaplan-Meier survival curves for animals treated with Saline, Dox with TLR9a, SQ3370, or SQ3370 with TLR9a . d) Tumor growth curves show mean ± SEM of large primary tumors injected with SQL70 biopolymer (injected tumors). e to g) Spider plots showing the growth of individual distal non-injected tumors in SQ3370, SQ3370 with TLR9a, and Dox with TLR9a treated groups, respectively. Tumor growth curves of individual non-injected tumors are displayed as a percentage of the initial volume of each tumor (measurement from day 12 post-inoculation) for each treatment group. Data points without errors bars occurred when the standard error was smaller than the symbol used to represent the treatment condition. Curves stopped after 1 or more mice in that group died or were sacrificed when tumor volume reached 2000 mm3. Gray bars represent treatment duration. Statistical significance in tumor growth curves was determined by unpaired t-test with Welch’s correction for each day. Statistical significance in survival was determined by log-rank (Mantel-Cox) test. *P<0.05; **P<0.01; ***P<0.001.

