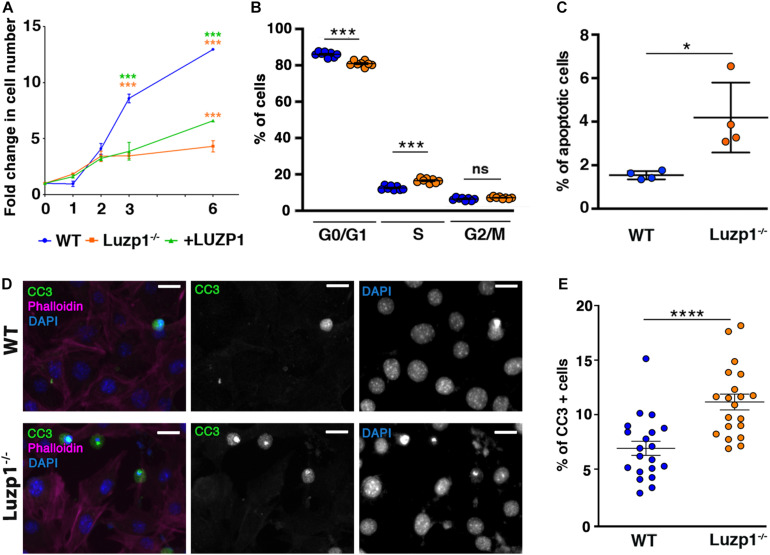
FIGURE 3.
Luzp1–/– cells exhibit lower viability and higher apoptosis than WT. (A) Graphical representation of fold change in cell numbers of WT (n = 5; blue line), Luzp1–/– (n = 5; orange line) and + LUZP1 cells (n = 5; green line). P-values were calculated using Two-way ANOVA and Sidak’s multiple comparisons test. (B) Graphical representation of the percentage of WT (blue dots) and Luzp1–/– cells (orange dots) in G0/G1, S or G2/M phases analyzed by EdU labeling and QIBC. P-values were calculated using Two-way ANOVA. (C) Graphical representation of the results of FACS analysis in Supplementary Figure S1B using Annexin V and DRAQ7 staining to determine the percentage of apoptotic cells in WT and Luzp1–/– cells in (n = 4). P-value was calculated using Mann Whitney-U test. (D) Representative micrographs showing WT and Luzp1–/– cells stained with the marker of mid-stage apoptosis cleaved caspase-3 (CC3) (green), phalloidin (magenta), and DAPI (blue). Black and white images show the single green and blue channels. Images were detected using Zeiss fluorescence microscope (Axio Imager D1), × 40 objective. Scale bar: 25 μm. (E) Graphical representation of quantification of CC3-positive cells in (D) showing the percentage of apoptotic cells in WT and Luzp1–/– cells (n = 20 micrographs, objective 20x). P-value was calculated using Mann Whitney-U test. The graphs in (A–C,E) represent the Mean and SEM. ∗P < 0.05; ∗∗∗P < 0.001; ****P < 0.0001.

