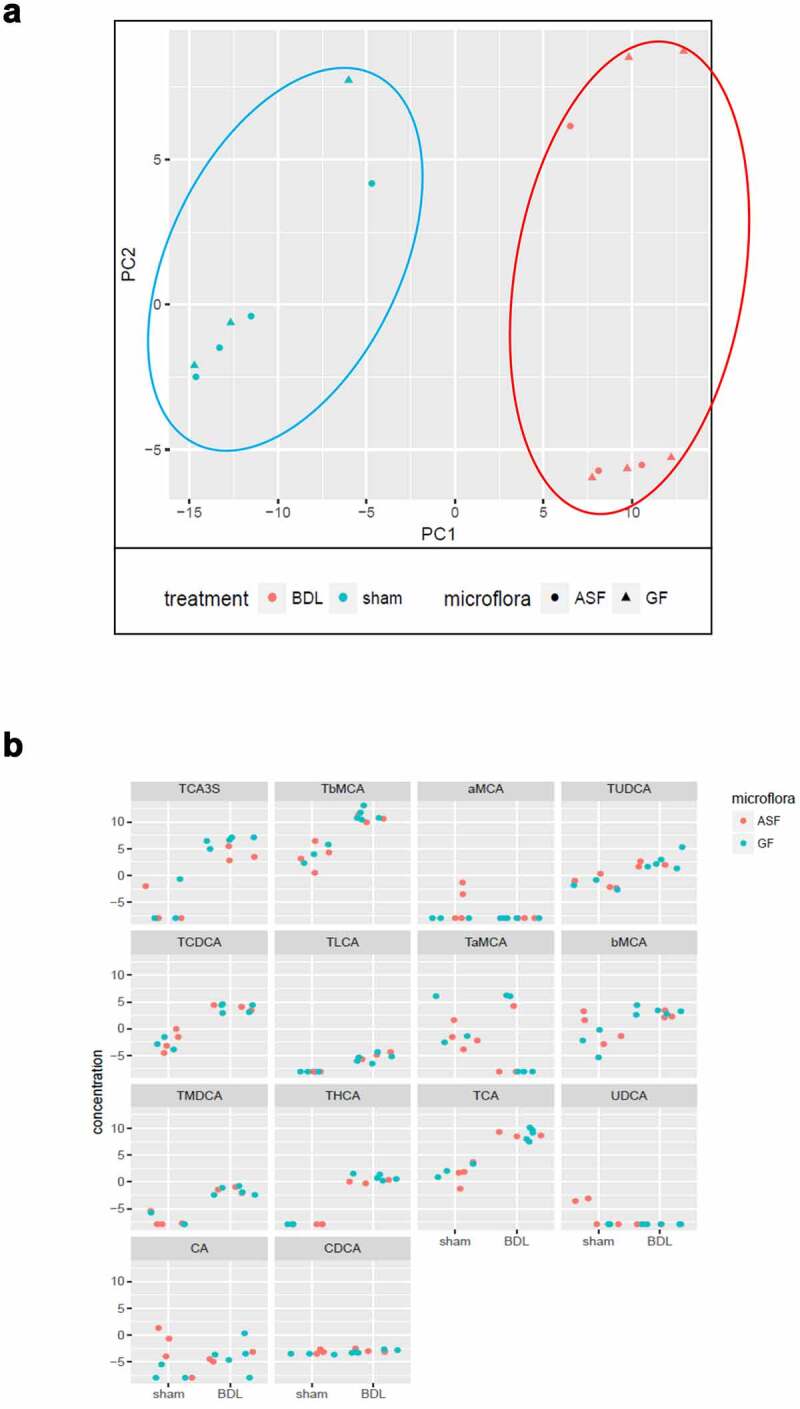
Figure 7.

Analysis of plasma metabolomic profile in GF and ASF mice shows unremarkable differences before and after acute cholestasis
Representative figures showing (A) Score blots showing PCA of plasma samples from sham (blue), with respect to BDL (red). (B) Bile acid profile in ASF vs GF after acute cholestasis. Abbreviations: ASF; altered Schaedler’s flora, GF; germ free, BDL; bile duct ligation PCA; principal component analysis.
