
Figure 1.
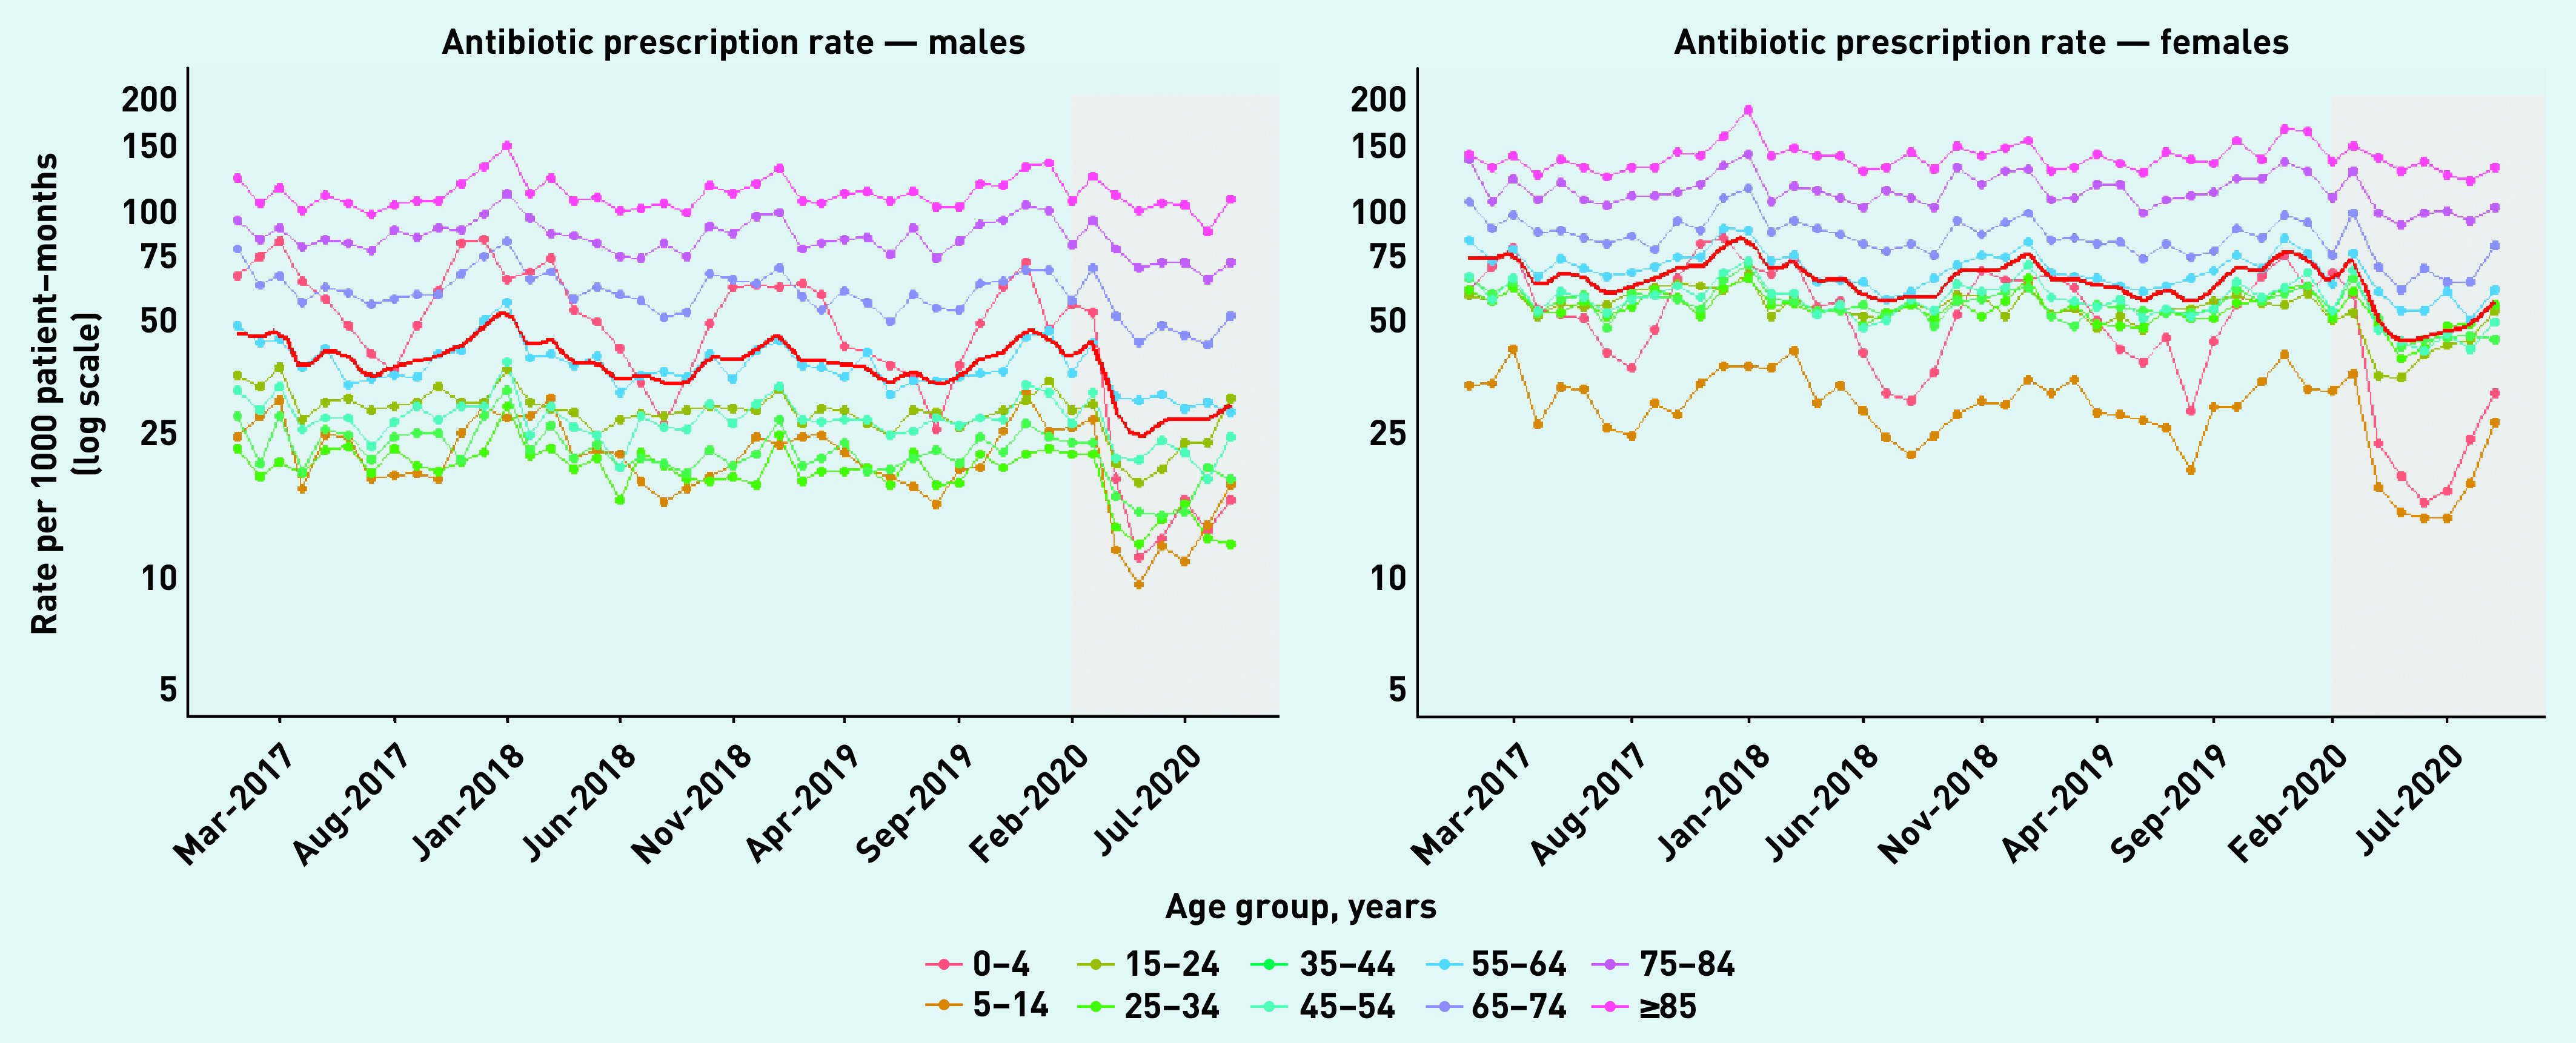
Age- and sex-specific total antibiotic prescribing rates for males (left) and females (right) with fitted LOESS curves (solid red line), January 2017 to pandemic period: February to September 2020 (grey).
Official websites use .gov
A
.gov website belongs to an official
government organization in the United States.
Secure .gov websites use HTTPS
A lock (
) or https:// means you've safely
connected to the .gov website. Share sensitive
information only on official, secure websites.
Age- and sex-specific total antibiotic prescribing rates for males (left) and females (right) with fitted LOESS curves (solid red line), January 2017 to pandemic period: February to September 2020 (grey).