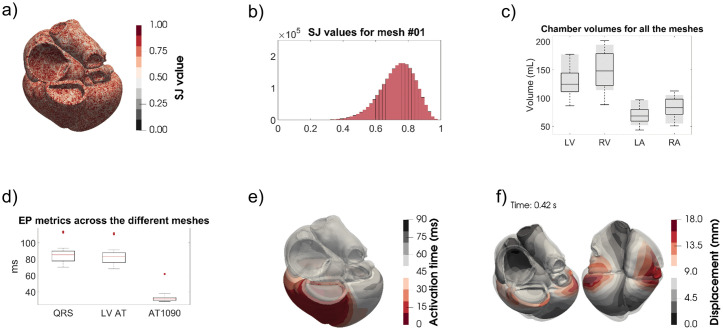
Fig 3. The different quality checks done on the meshes.
a) Example of the SJ values projected in a mesh (#01). b) The histogram corresponding to the SJ values of a). c) The blood pool volumes compared with those in the UK Biobank (shaded grey). d) The activation times as described in the text. e) An example of the activation times (each isochrone corresponding to 10 ms). f) The displacement of the mechanics simulation (in translucid the end-diastolic configuration) for mesh #01.

