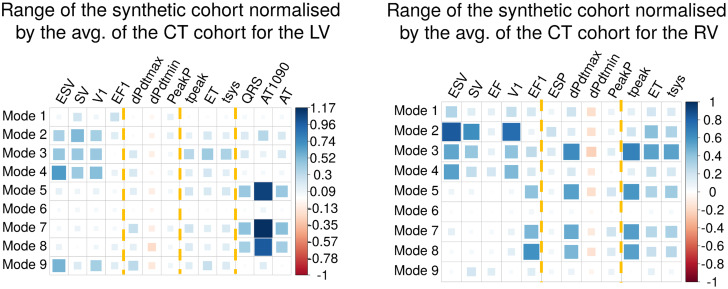
Fig 8. Normalised ranges for the synthetic cohort: For the LV on the left and for the RV on the right.
Colour and size indicate the sign and the magnitude of the value. The bigger the value, the more sensitive that phenotype is to changes in that mode. Yellow dotted lines indicate each group of phenotypes: volume-based, pressure-based, time/duration-based and EP-based.

