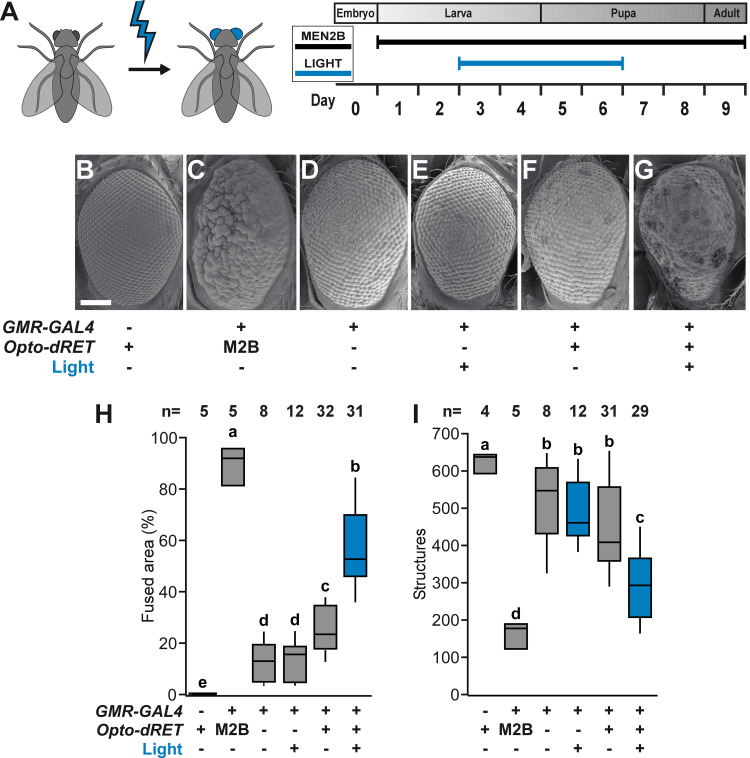
Fig 2. Induction of retina roughening and phenotype quantification.
(A) Developmental time window targeted by light in retina experiments. (B-G) Representative retina SEM images. Scale bar: 0.1 mm. (H and I) Quantification of rough retina phenotypes of one-day old flies as fused area and the number of structures identified. “M2B” denotes Opto-dRETMEN2B. The number of analyzed flies is given (at least three independent experiments) and bars sharing the same label are not significantly different (ANOVA/Bonferroni corrected t-tests of means, p>.04). Continuous light intensity was 385 μW/cm2 for the duration shown in A.

