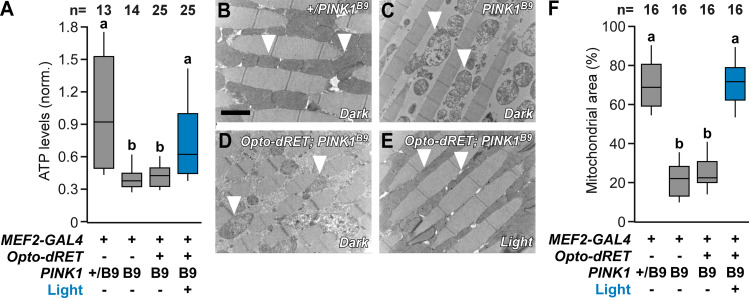
Fig 4. Improved mitochondrial structure and function.
(A) ATP content in fly thoraces from PINK1B9 flies at the indicated conditions (normalized to the mean for control flies shown as bar 1). (B-E) Representative TEM images of thoracic indirect flight muscles. Arrow heads indicate mitochondria that are either electron dense (B: controls, E: illuminated PINK1B9 Opto-dRET flies) or malformed with disintegrated cristae (C: PINK1B9 flies, D: PINK1B9 Opto-dRET flies in the absence of light). Scale bar: 2 μm. (F) Analysis of mitochondrial density in TEM images. “M2B” denotes Opto-dRETMEN2B. PINK1 “+” denotes the WT gene. In A, the number of analyzed flies is given (at least three independent experiments) and bars sharing the same label are not significantly different (ANOVA/Bonferroni corrected t-tests of means, p>.04). In F, the number of analyzed micrographs is given (at least three independent experiments) and bars sharing the same label are not significantly different (ANOVA/Bonferroni corrected t-tests of means, p>.04). Continuous light intensity was 320 μW/cm2 for the duration shown in Fig 3A.

