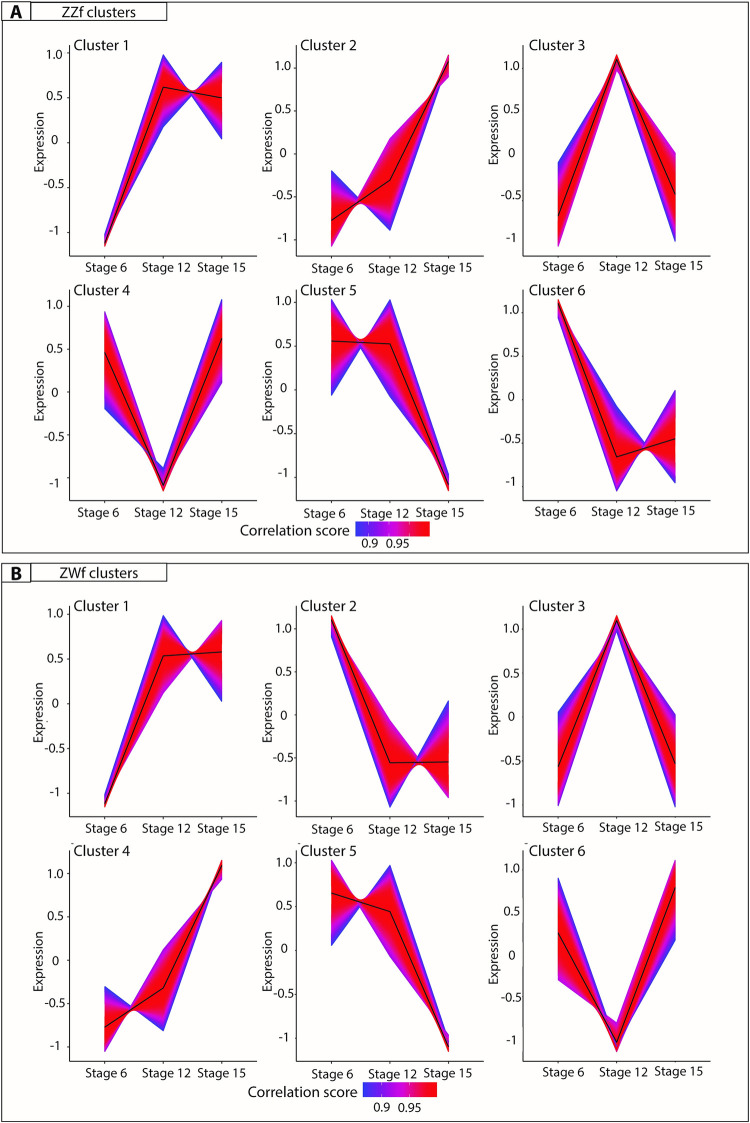
Fig 6.
K-means clustering analysis on normalized counts per million for ZZf (A) and ZWf (B) across all developmental stages. The colour depicts the correlation score of each gene in the cluster, where numbers approaching one (red) have the strongest correlation. All gene lists produced for each cluster are provided in S5 Data.

