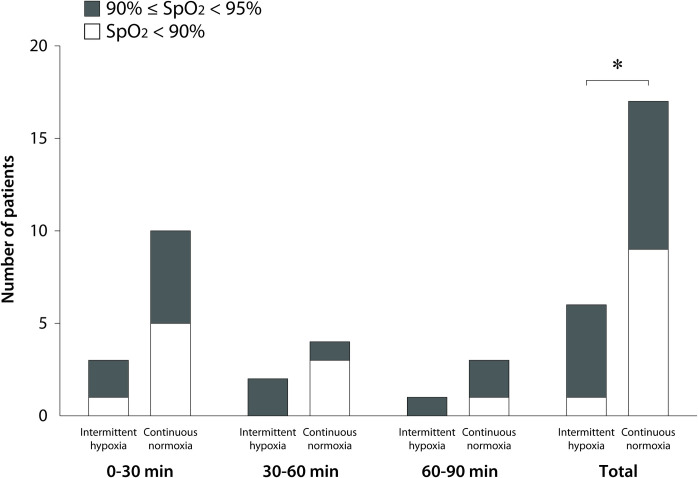
Fig 2. Number of hypoxemic patients with SpO2 <95% for 0–30, 30–60, and 60–90 min after starting one-lung ventilation.
*6/68 (8.8%) vs 17/68 (25.0%), risk ratio (95% CI) 0.35 (0.15–0.84), P = 0.012 by chi-squared test for SpO2 <95%; 1/68 (1.5%) vs 9/68 (13.2%), risk ratio (95% CI) 0.11 (0.01–0.85), P = 0.017 by Fisher’s exact test for SpO2 <90%.

