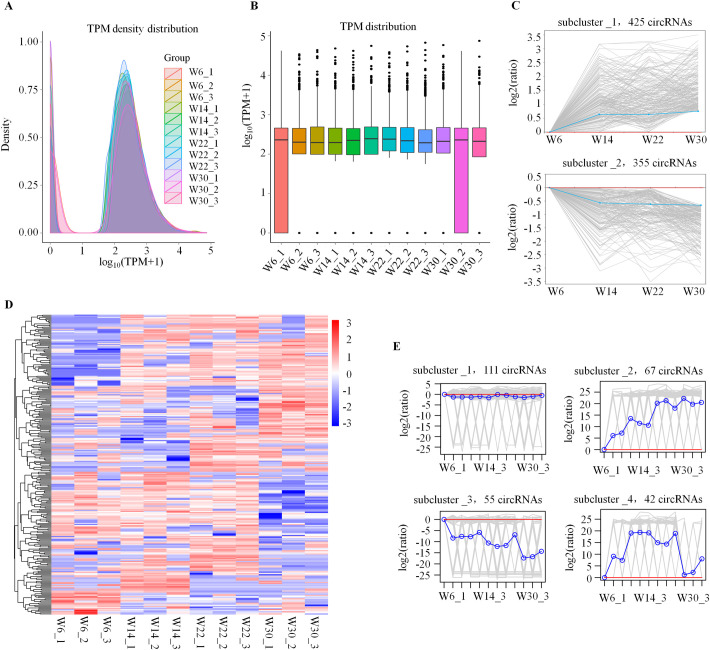
Fig 2. Expression analysis of circRNAs during the development of abdominal fat in Gushi chickens.
(A) Density distribution of TPM values of circRNAs in each library. (B) Box plot of TPM values of circRNAs in 12 libraries. (C) Two subclusters of the circRNA expression profile in Gushi chicken abdominal adipose tissue. K-means clustering was used to represent the circRNA dynamic profile. The gray line is a line chart representing the relative expression level of a given circRNA for the four developmental stages. The blue line is a line chart representing the relative mean expression level of all circRNAs for the four developmental stages. The red line is for reference; circRNAs above the red line were upregulated, and those below the red line were downregulated. (D) Hierarchical clustering of the DE circRNAs in 12 libraries. (E) K-means cluster map of the DE circRNAs.

