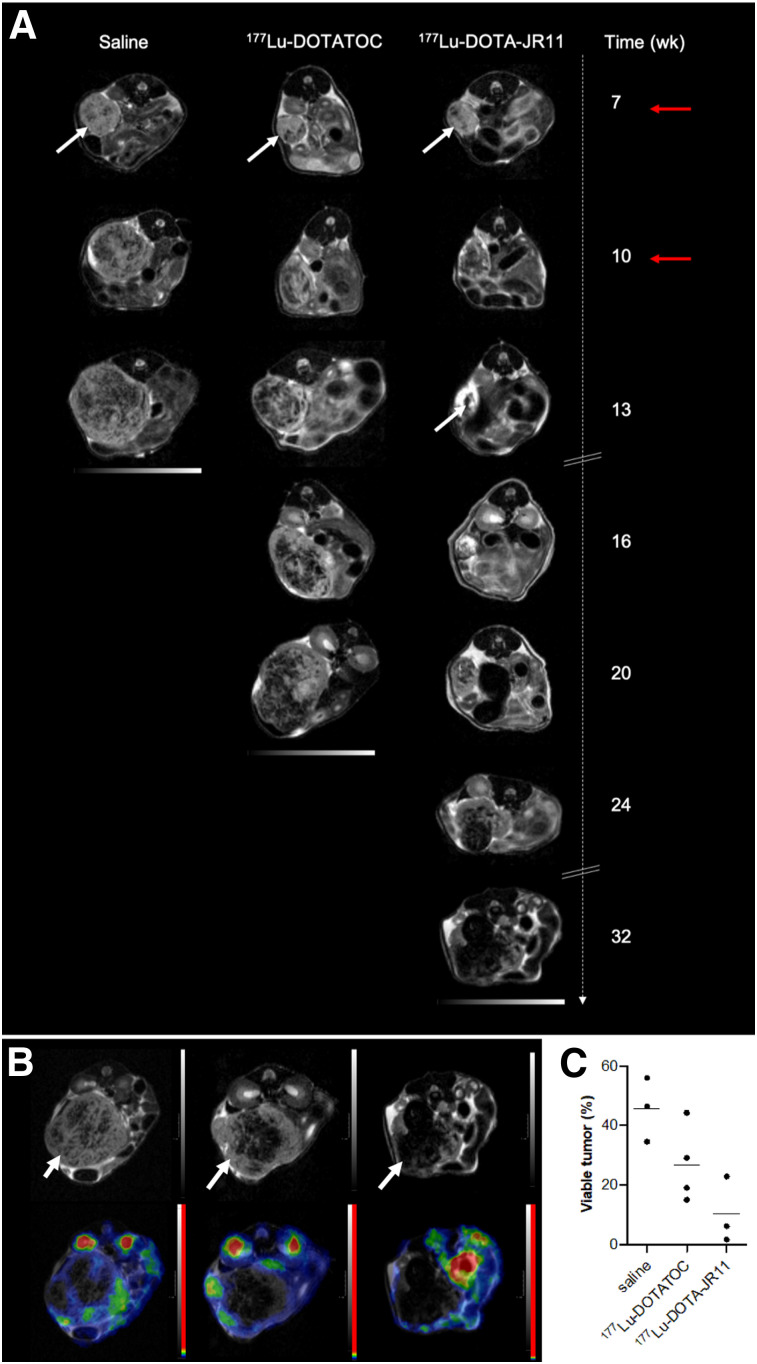
FIGURE 3.
Tumor tissue monitoring over time. (A) Representative axial T2-weighted MRI of orthotopic tumors (white arrows) for different treatment regimens. Animals received 2 injections (red arrows) of 100 μL of saline, 30 MBq of 177Lu-DOTATOC, or 20 MBq of 177Lu-DOTA-JR11. Tumor tissue appears rather hyperintense, whereas increasing portion of nonviable (e.g., necrotic) tissue appears hypointense. (B) Corresponding T2-weighted MRI (upper row) and 18F-FDG PET/MRI (lower row); metabolically active regions are seen within tumor. (C) Dot plot representing viable tumor volume and mean values (horizontal line).

