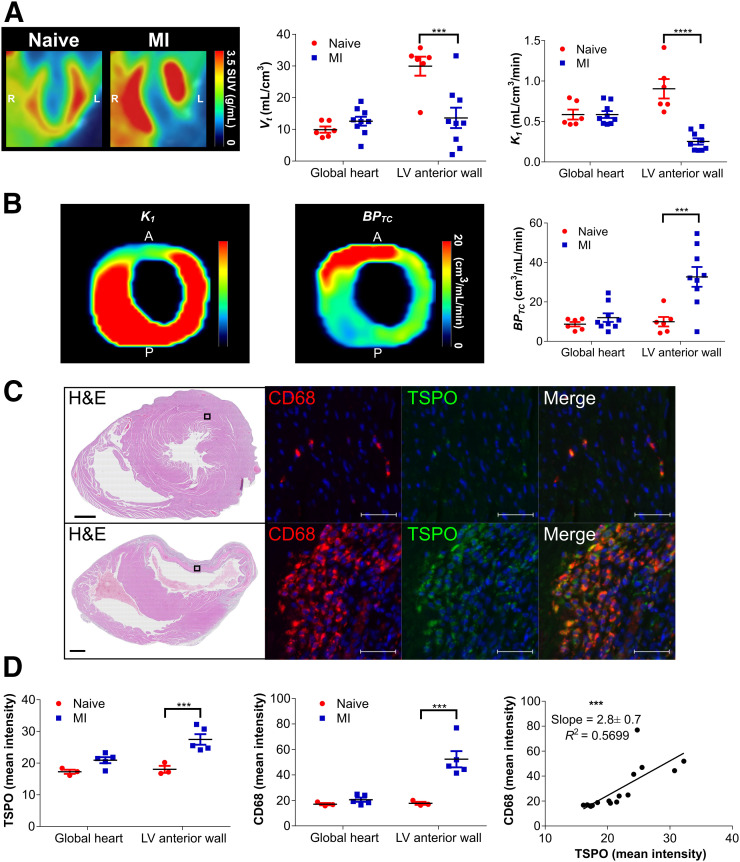
FIGURE 4.
18F-LW223 PET with BPTC quantification detects macrophage-driven inflammation within heart 7 d after MI without need for additional perfusion scan. (A) Long-axis representative SUV image of heart in naïve and MI rats showing increased global uptake and lack of signal within LV anterior wall due to MI-mediated reduction in perfusion (left) (images were filtered using gaussian 1 × 1 × 1 mm filter)); non–perfusion-corrected VT within global heart and LV anterior wall, which was site of infarct (middle); and K1 acting as surrogate marker of perfusion, being reduced within LV anterior wall (right). (B) Representative K1 (left) and BPTC images (middle) of LV of MI rat demonstrating true TSPO signal across heart; BPTC values across global heart and LV anterior wall demonstrating that most TSPO is expressed within infarct (right). n = 6 for natïve and n = 9 for MI. (C) Representative histology examples of hearts from naïve (top) and MI (bottom) rat. Hematoxylin and eosin (H&E) overview (scale bar = 1,000 μm) contains box that indicates position of CD68 examples (macrophage marker) and TSPO examples (scale bar = 50 μm), demonstrating specificity of TSPO for macrophages, which are mostly present within infarct. (D) Quantification of TSPO immunofluorescent stain indicating that most signal is present within LV anterior wall (left), as is also true for CD68 quantification (middle); comparison of TSPO and CD68 indicates significant correlation within heart (right). n = 3 for naïve and n = 5 for MI. All results represent mean ± SEM. P values were obtained using 2-way ANOVA with post hoc Sidak for naïve vs. MI, apart from correlation analysis, which used Pearson correlation. A = anterior; P = posterior. **P ≤ 0.01. ***P ≤ 0.001. ****P ≤ 0.0001.

