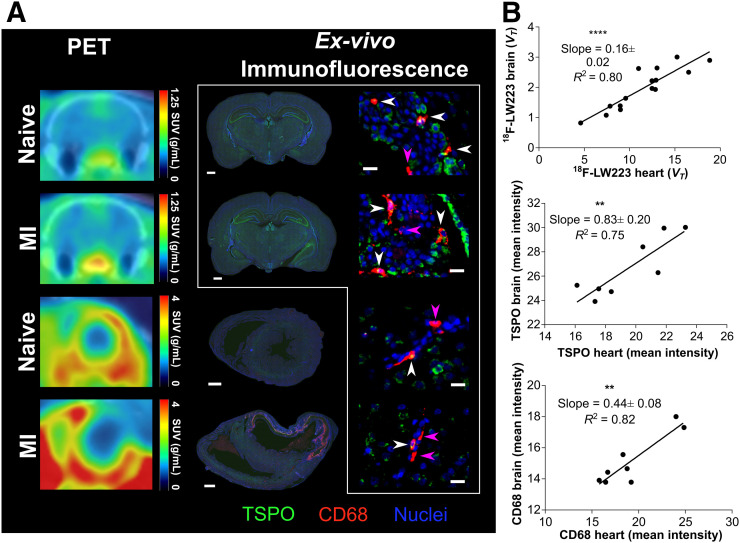
FIGURE 5.
Heart–brain axis in health and after MI. (A) Representative 18F-LW223 brain (top, coronal section) and heart (bottom, short axis) PET/CT images of naïve and MI rats (left); CD68 (red) and TSPO (green) immunofluorescence within same animals (middle, scale bar = 1,000 μm); and regional brain immunofluorescence within lateral ventricles of naïve (top) and MI (second from top) rats and within thalamus of naïve (second from bottom) and MI (bottom, scale bar = 20 μm) rats. White arrowheads denote cells that are both CD68- and TSPO-positive; pink arrowheads denote cells positive only for CD68. Cells positive only for TSPO were abundant and are not specifically denoted. (B) Comparison of 18F-LW223 VT in heart and brain of naïve and MI rats showing strong correlation, (n = 15), as is also true for TSPO (n = 8) and CD68 (n = 8). P values were obtained using Pearson correlation. **P ≤ 0.01. **P ≤ 0.0001.

