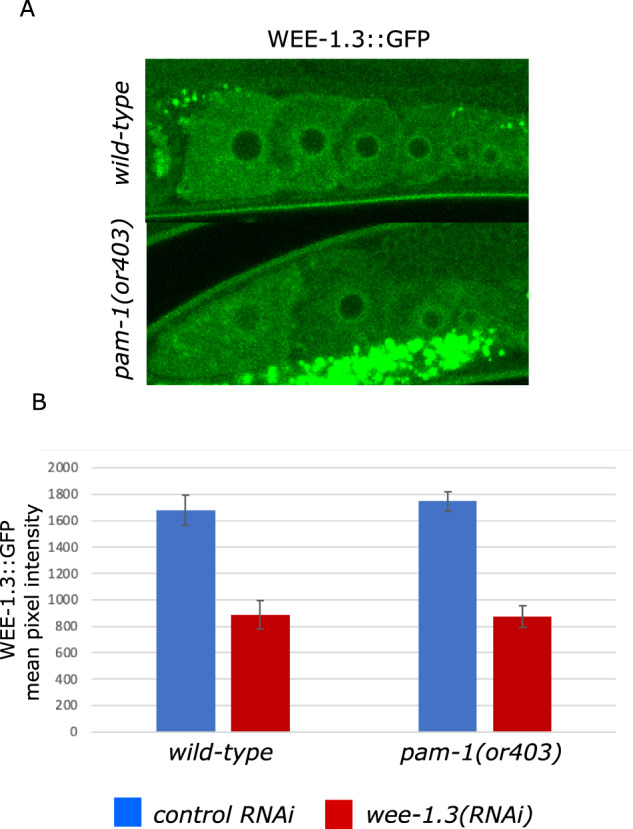
Figure 5.

WEE-1.3 levels are comparable in wild-type and pam-1 oocytes. Confocal images of WEE-1.3::GFP show no difference in the localization of WEE-1.3 in wild-type (n = 19) and pam-1 mutant (n = 16) oocytes. The bright dots in the lower panel are autofluorescence of gut granules. (B) When the intensity of WEE-1.3 was compared in each oocyte, (-1 oocyte shown here) no difference was determined between strains; however, RNAi of wee-1.3 (WT n=13 and pam-1 n = 9) significantly reduced the levels. ANOVA P < 0.001.
