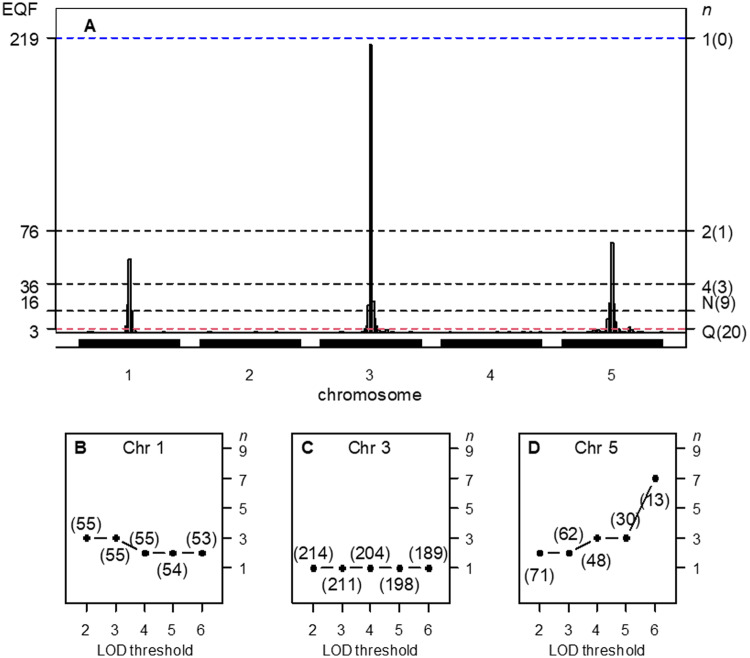
Figure 2.
(A–D) The hotspot architecture and the top profiles of the three simulated hotspots across the 2- to 6-LOD EQF architectures. (A) Inferred hotspot architecture using a single-trait permutation LOD threshold of 2.47 corresponding to a GWER of 5% of falsely detecting at least one QTL somewhere in the genome. The hotspots on chromosomes 1, 3, and 5 have sizes 55, 214, and 67, respectively. The thresholds are coordinately represented by the left and right axes. The left axis denotes the values of EQF, and the right axis denotes the values of n. The dashed line at count 16 corresponds to the hotspot size threshold at a GWER of 5% according to the N-method. The dashed line at count 3 corresponds to the Q-method’s 5% significance threshold. The thresholds , , and obtained by the proposed procedure are 219, 76, and 36, respectively. The number in the bracket on the right axis denotes the number of detected hotspots. (B) The top profile for hotspot A shows a decreasing pattern with the value of n decreasing from 3 to 2 over the 2- to 6-LOD EQF architectures, indicating that hotspot A contains relatively more QTL with large LOD scores. (53): the hotspot size (number of QTL) is 53 and the top threshold is in the 6-LOD EQF threshold. (C) The top profile for hotspot B shows a flat pattern with n 1 for all the EQF architectures, indicating that hotspot B containing QTL with balanced LOD scores. (D) The top profile for hotspot C shows an increasing pattern with the value of n increasing from 2 to 7 over the five EQF architectures, indicating that hotspot C contains relatively fewer QTL with large LOD scores. Results are based on 1,000 permutations. Q: The Q-method; N: The N-method.

