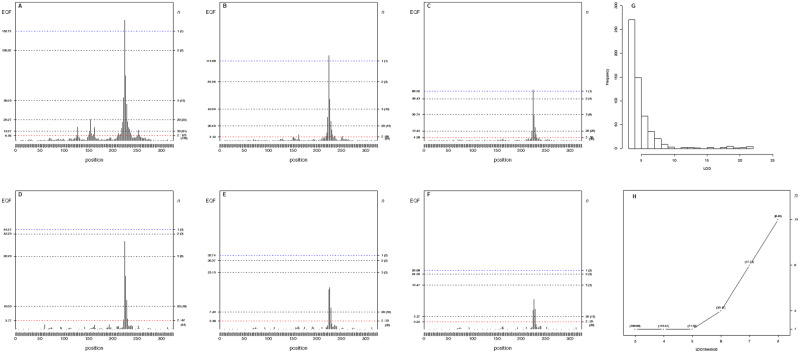
Figure 5.
(A–H) The 3- to 8-LOD EQF architectures of the second chromosome and the EQF thresholds at GWER of 5% for the yeast dataset. The left axis denotes the values of EQF, and the right axis denotes the values of n. (A–F) The peak at the bin [2,224] is significant as a hotspot under the , and thresholds in the 3- to 8-LOD EQF architectures. For (A)–(F), the number in the bracket is the number of detected hotspots. (G) The distribution of LOD scores >3 for the QTL at the bin [2,224]. (H) The top profile shows that the values of n are 1, 1, 1, 3, 8, and 13, showing an increasing pattern, across the 3- to 8-LOD EQF architectures. For (G) and (H), the number in the bracket is the EQF value of the bin.

