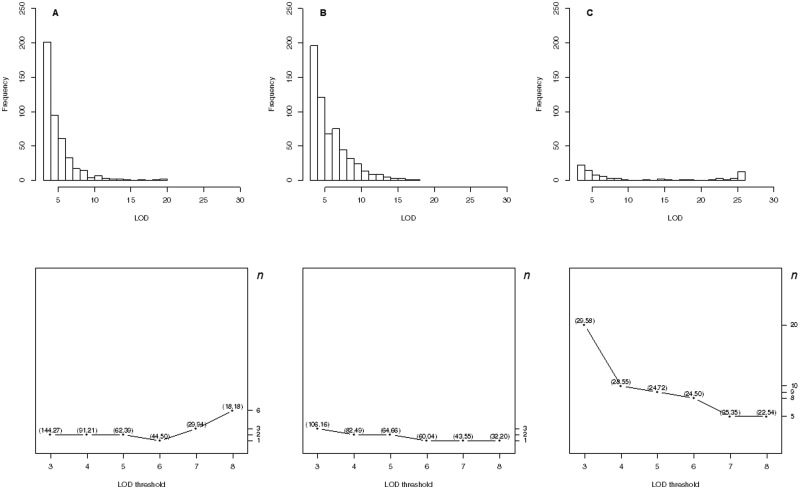
Figure 6.
(A–C) The distributions of QTL with LOD scores >3 and the top profiles for the bins [15,60], [14,242] and [3,89.5] (the first marker on chromosome 3 starting at the position of 9.5 cM) for the yeast dataset. The upper panels display the distributions of LOD scores, and the bottom panels show the top profiles. (A) The top profile displays that the n values have an increase trend within the narrow range from 1 to 5 over the 3- to 8-LOD thresholds, showing that the bin [15,60] is a major hotspot containing QTL with balanced LOD scores. (B) The top profile displays a flat pattern with the values of n varying within the range of from 1 to 3 showing that the bin [14,242] is also a major hotspot containing the QTL with balanced LOD scores. (C) The top profile has a decreasing trend over the 3- to 8-LOD thresholds, showing that the bin [3,89.5] is also a major hotspot containing relatively more QTL with LOD scores. The number in the bracket is the EQF value of the bin.

