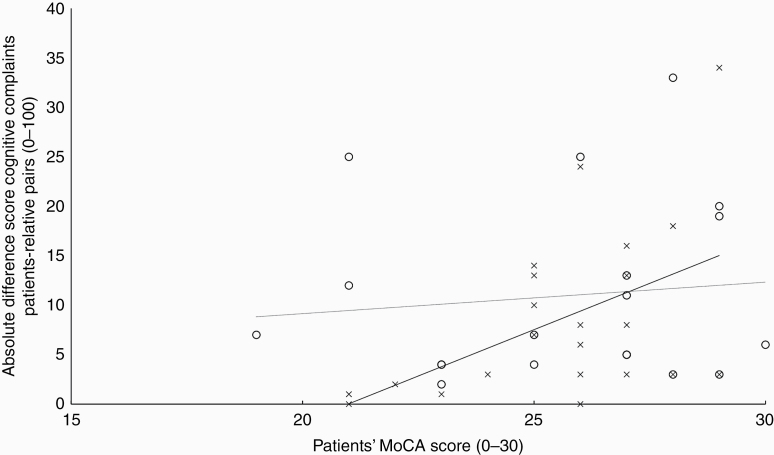
Figure 4.
Scatterplot visualizing the association between the absolute difference score of total cognitive complaints of patient-relative pairs and patients’ general cognitive functioning (MoCA). Note: Crosses represent patients reporting more cognitive complaints than their relatives’ estimations (black linear trendline), and circles represent patients reporting fewer cognitive complaints compared to their relatives (dotted linear trendline).

