
Figure 1.
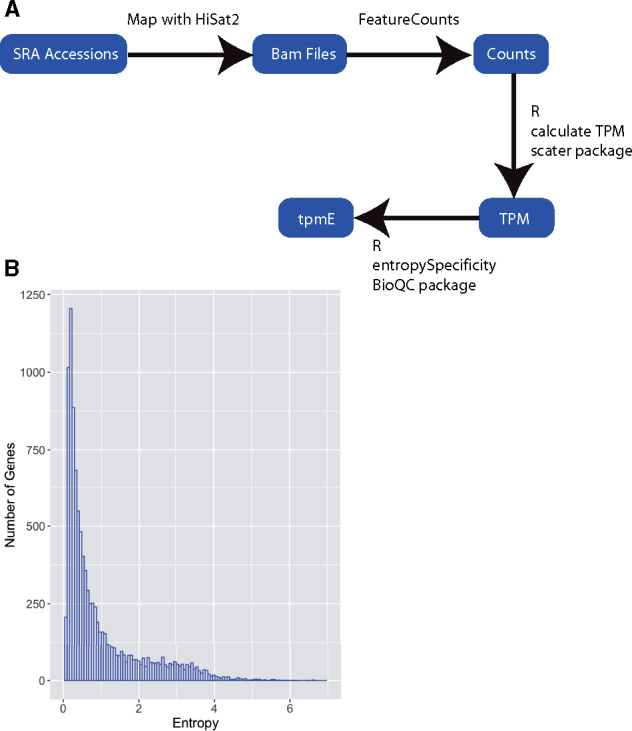
Calculation of Shannon entropy for N. crassa genes using public RNA-seq data. (A) Schematic of our computational pipeline for calculating Shannon entropy from publicly available datasets. (B) Neurospora crassa genes display a broad range of entropy values. The histogram shows entropy values for all genes. The y-axis is the number of genes found in each bin. The x-axis shows the binned entropy values.