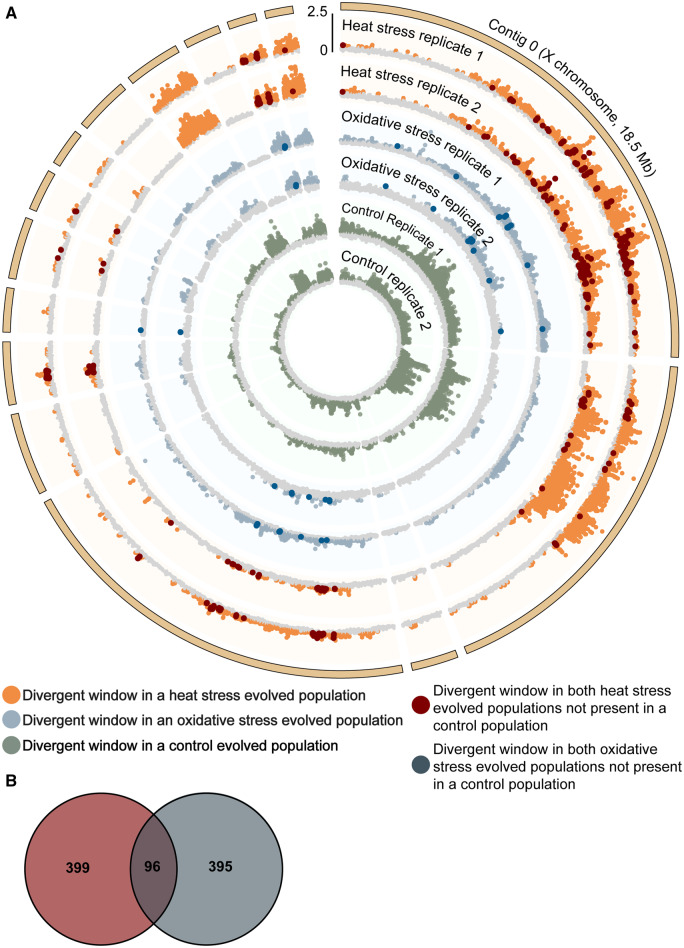
Figure 2.
Location of divergent SNPs on two contigs in the heat stress evolved populations (top panel), the oxidative stress evolved populations (middle panel), and all evolved populations together (bottom panel). Only genomic sites with a Bonferroni corrected P-value less than or equal to 0.05 are shown.

