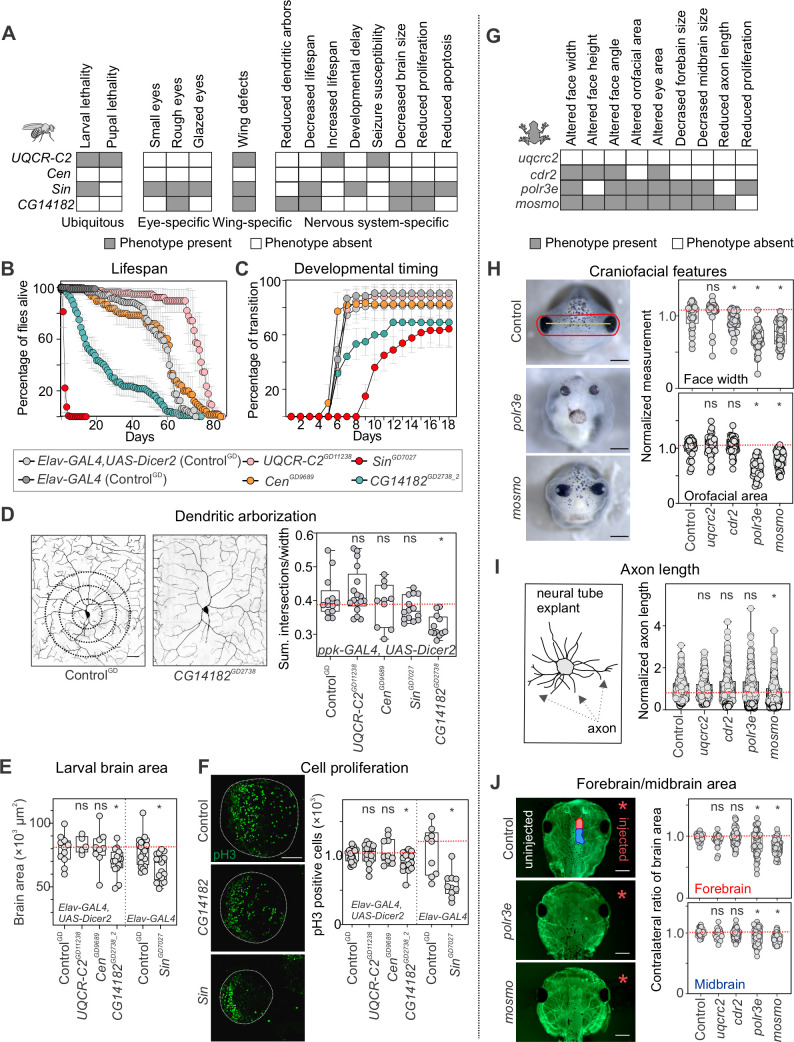
Fig 2. Multiple homologs of 16p12.1 genes contribute to neurodevelopmental defects in Drosophila melanogaster and X. laevis.
(A) Schematic showing multiple phenotypes affected by tissue-specific knockdown of individual 16p12.1 homologs in Drosophila melanogaster. Ubiquitous knockdown was achieved with da-GAL4, eye-specific knockdown with GMR-GAL4, wing-specific knockdown with bxMS1096-GAL4, and nervous system-specific with ppk-GAL4 or Elav-GAL4. See S2A–S2C Fig for details on phenotypes observed for individual fly lines. (B) Nervous-system mediated knockdown using Elav-GAL4 with overexpression of Dicer2 at 25°C led to reduced lifespan with knockdown of CG14182GD2738_2 (n = 100, one-way repeat measures ANOVA with post-hoc pairwise t-test, days 6–61, p<0.05) and increased lifespan with knockdown of UQCR-C2GD11238 (n = 120, days 51–81, p<0.05). Elav-GAL4 mediated knockdown of SinGD7027 at RT without overexpression of Dicer2 led to reduced lifespan of adult flies (n = 160, day 1–6, p<0.05). Data represented show mean ± standard deviation of 4–8 independent groups of 20 flies for each line tested. (C) Nervous-system mediated knockdown led to delayed pupariation time and larval lethality for SinGD7027 (n = 180, one-way repeat measures ANOVA with post-hoc pairwise t-test, days 6–18, p<0.05) and partial larval lethality for CG14182GD2738_2 (n = 120, days 7–11, p<0.05). Data represented show mean ± standard deviation of 4–9 independent groups of 30 larvae for each line tested. (D) Knockdown of 16p12.1 homologs in sensory class IV dendritic arborization neurons using ppk-GAL4 with overexpression of Dicer2 showed reduced complexity of dendritic arbors (measured as sum of intersections normalized to width) for CG14182GD2738 (n = 12, two-tailed Mann-Whitney, *p = 5.35 ×10⁻⁵). Scale bar represents 25 μm. (E) Third instar larvae with nervous system-specific knockdown of 16p12.1 homologs showed reduced brain area for CG14182GD2738_2 (n = 15, two-tailed Mann-Whitney, *p = 0.047) and SinGD7027 (n = 17, *p = 0.001). (F) Developing third instar larvae with knockdown of CG14182GD2738_2 (n = 15, two-tailed Mann-Whitney, *p = 0.026) and SinGD7027 (n = 10, *p = 9.74×10⁻⁴) showed reduced number of phosphorylated Histone-3 (pH3) positive cells in the brain lobe (green). Scale bar represents 50 μm. All control data for Drosophila represents phenotypes observed for the GD VDRC control (ControlGD) crossed with the indicated tissue-specific GAL4 driver. (G) Schematic showing the phenotypes observed with knockdown of 16p12.1 homologs in X. laevis. (H) Representative images of tadpoles injected with control morpholino, indicating facial landmarks for face width (yellow) and orofacial area (red), and tadpoles with knockdown of polr3e and mosmo. Knockdown of cdr2 (n = 54, two-tailed student’s t-test, *p = 7.75 ×10⁻⁴), polr3e (n = 37, *p = 1.97 ×10⁻¹³) and mosmo (n = 50, *p = 1.36 ×10⁻¹¹) led to decreased face width, while knockdown of polr3e (*p = 3.29 ×10⁻¹⁶) and mosmo (*p = 1.47 ×10⁻⁸) led to decreased orofacial area. All measures were normalized to their respective control injected with the same morpholino amount. Scale bar represents 500 μm. (I) Strong knockdown of mosmo led to decreased axon length in neural tube explants (n = 566, two-tailed student’s t-test, *p = 7.40 ×10⁻¹²). All measures were normalized to their respective control injected with the same morpholino amount. Representative schematic for axon length measurements is shown on the left. (J) Representative images show forebrain (red on control image) and midbrain (blue) areas of the side injected with morpholino (right, red asterisk), which were normalized to the uninjected side (left). Strong knockdown of mosmo (n = 67, two-tailed student’s t-test, *p<3.07×10⁻¹³) and polr3e (n = 48, *p<7.39×10⁻⁴) led to decreased midbrain and forebrain area of X. laevis tadpoles (stained with tubulin). Scale bar represents 500 μm. In all cases, X. laevis data represents strong knockdown of the 16p12.1 homologs, except for cdr2, which showed lethality and is represented with partial knockdown. All control data for X. laevis represents controls injected with the highest amount of morpholino (50 ng, see S5 Fig). Boxplots represent all data points with median, 25th and 75th percentiles, and red dotted lines indicate the control median. Statistical details, including sample size, confidence intervals, and p-values, are provided in S6 File. A list of full genotypes for fly crosses used in these experiments is provided in S1 File.

