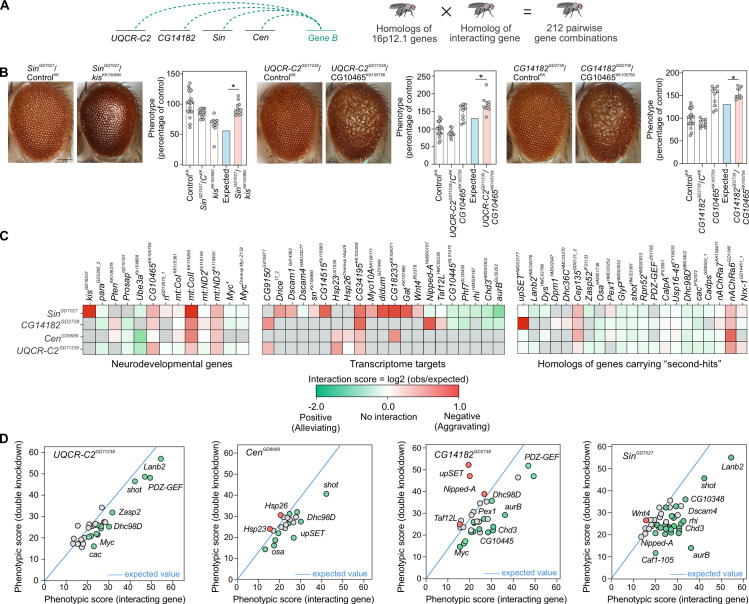
Fig 4. Homologs of 16p12.1 genes show complex interactions with conserved neurodevelopmental genes and homologs of patient-specific “second-hit” genes.
(A) We evaluated how homologs of genes outside of the CNV region (Gene B), including genes carrying “second-hit” variants in children with the 16p12.1 deletion, genes within conserved neurodevelopmental pathways, and transcriptome targets, affect the phenotypes observed for homologs of 16p12.1 genes. We crossed eye-specific recombinant lines for each homolog with a total of 124 RNAi, mutant or overexpression lines for 76 interacting genes to test a total of 212 pairwise gene combinations. (B) Representative brightfield images of Drosophila adult eyes for recombinant lines of 16p12.1 homologs crossed with background-specific controls (ControlKK, also represented as CKK) or RNAi lines for kis and CG10465, are shown as examples of genetic interactions between the 16p12.1 homologs and homologs of neurodevelopmental genes. Bar plots show normalized phenotypes (median ± interquartile range) for 16p12.1 recombinant lines crossed with background-specific control or with RNAi lines for interacting genes. SinGD7027 negatively interacted with kisKK100890 and led to a more severe phenotype (two-tail one-sample Wilcoxon signed rank test with Benjamini-Hochberg correction, n = 11, *p = 0.012, in red) than expected (in blue) under a multiplicative model. Similarly, CG10465KK105756 negatively interacted with UQCR-C2GD11238 (n = 10, *p = 0.024) and CG14182GD2738 (n = 10, *p = 0.015), leading to more severe eye phenotypes than expected. Phenotypes are represented as percentage of average, i.e. normalized to Flynotyper scores from control flies carrying the same genetic background as the interacting gene. Scale bar represents 100 μm. (C) Heatmaps show interaction scores calculated as the log2 ratio between the average of observed and expected phenotypic scores. Positive scores represent negative aggravating genetic interactions (in red), while negative scores represent positive alleviating interactions (in green). Grey boxes indicate pairwise crosses that were not tested or were not validated by multiple lines. A complete list of interaction scores is provided in S4 File. (D) Scatter plots depict interactions tested for 16p12.1 homologs. The plots show the average phenotypic score of the interacting gene on the x-axis, and the average observed phenotypic score for the pairwise knockdown on the y-axis. The blue line represents the expected phenotypic score of the pairwise knockdown calculated for each 16p12.1 homolog (value of first hit crossed with control, such as UQCR-C2GD11238 × ControlBL), and all possible phenotypic scores (ranging from 0 to 60) of the interacting genes are represented on the x-axis. All positive and negative (validated or potential) interactions are represented in green and red, respectively, and fly lines of genes with no significant interactions are shown in grey. Only lines from the BDSC stock center are represented here; S17 Fig shows scatter plots representing VDRC stock lines.

