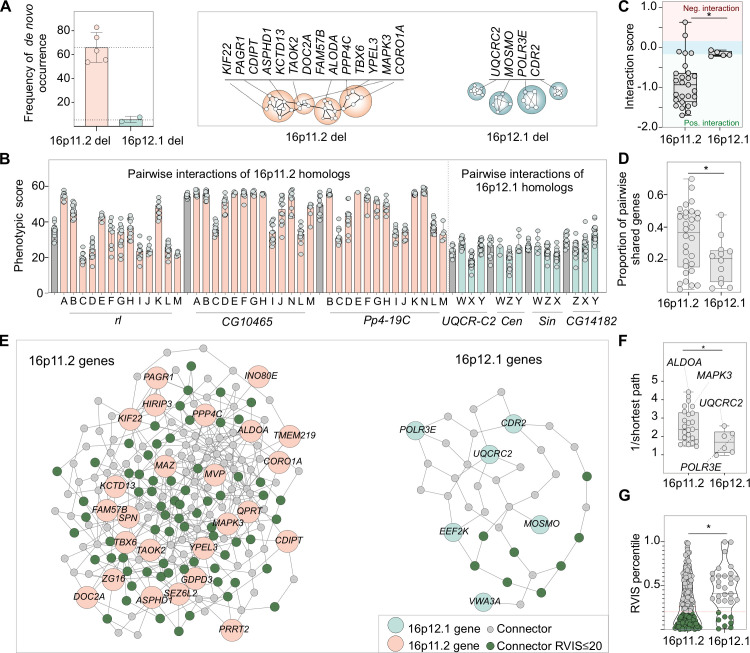
Fig 7. Functional relatedness of genes within disease-associated CNV regions correspond with higher pathogenicity.
(A) Bar plot shows frequency of reported de novo occurrence of the 16p12.1 deletion [9,11] compared to the autism-associated 16p11.2 deletion [11,74,75]. Schematic shows a model for higher functional connectivity of genes within the 16p11.2 region compared to the 16p12.1 region. Only genes with Drosophila homologs are represented. (B) Phenotypic scores of individual 16p11.2 homologs (grey) are significantly enhanced or suppressed by a second 16p11.2 homolog (orange). In contrast, little variation in phenotypic scores is observed for 16p12.1 homologs (grey) with simultaneous knockdown of another homolog (green). The interacting homologs are labeled as follows: A: Pp4-19C (PPP4C), B: CG17841 (FAM57B), C: coro (CORO1A), D: Ald1 (ALDOA), E: Rph (DOC2A), F: Tao (TAOK2), G: Asph (ASPHD1), H: klp68D (KIF22), I: Pa1 (PAGR1), J: Pis (CDIPT), K: CG10465 (KCTD13), L: CG15309 (YPEL3), M: Doc3 (TBX6), N: rl (MAPK3), W: CG14182 (MOSMO), X: Cen (CDR2), Y: Sin (POLR3E), Z: UQCR-C2 (UQCRC2). (C) Pairwise knockdown of homologs of 16p11.2 genes (n = 27) show a larger magnitude of interactions compared with those among 16p12.1 homologs (n = 5, two-tailed Mann-Whitney test, *p = 0.011). Interaction values of zero (blue shade) represent no interactions, while values above or below zero represent negative (in red) and positive (in green) interactions, respectively. (D) Pairs of 16p11.2 homologs exhibit a higher proportion of shared differentially-expressed genes compared to pairs of 16p12.1 homologs (n = 30 for 16p11.2, n = 12 for 16p12.1, two-tailed Mann-Whitney test, *p = 0.031). (E) Network diagram shows connections between human 16p11.2 or 16p12.1 genes within a brain-specific interaction network. 16p12.1 genes are indicated in green, 16p11.2 genes in orange, connector genes in grey, and connector genes that are intolerant to functional variation (RVIS ≤ 20th percentile) in dark green. C16orf92 and C16orf54 for 16p11.2 and PDZD9 for 16p12.1 were not present in the brain network and were therefore excluded from the network analysis. (F) Genes within the 16p11.2 region show higher average pairwise connectivity in a human brain-specific network, measured as the inverse of the shortest paths between two genes, compared to 16p12.1 genes (n = 25 for 16p11.2, n = 6 for 16p12.1, two-tailed Mann-Whitney, *p = 0.036, see S5 File). (G) 16p11.2 connector genes have lower RVIS percentile scores compared to 16p12.1 connector genes (n = 166 for 16p11.2, n = 33 for 16p12.1, two-tailed Mann-Whitney, *p = 0.017, see S5 File). Functionally-intolerant genes are represented in dark green. Boxplots represent all data points with median, 25th and 75th percentiles. Statistical details are provided in S6 File.

