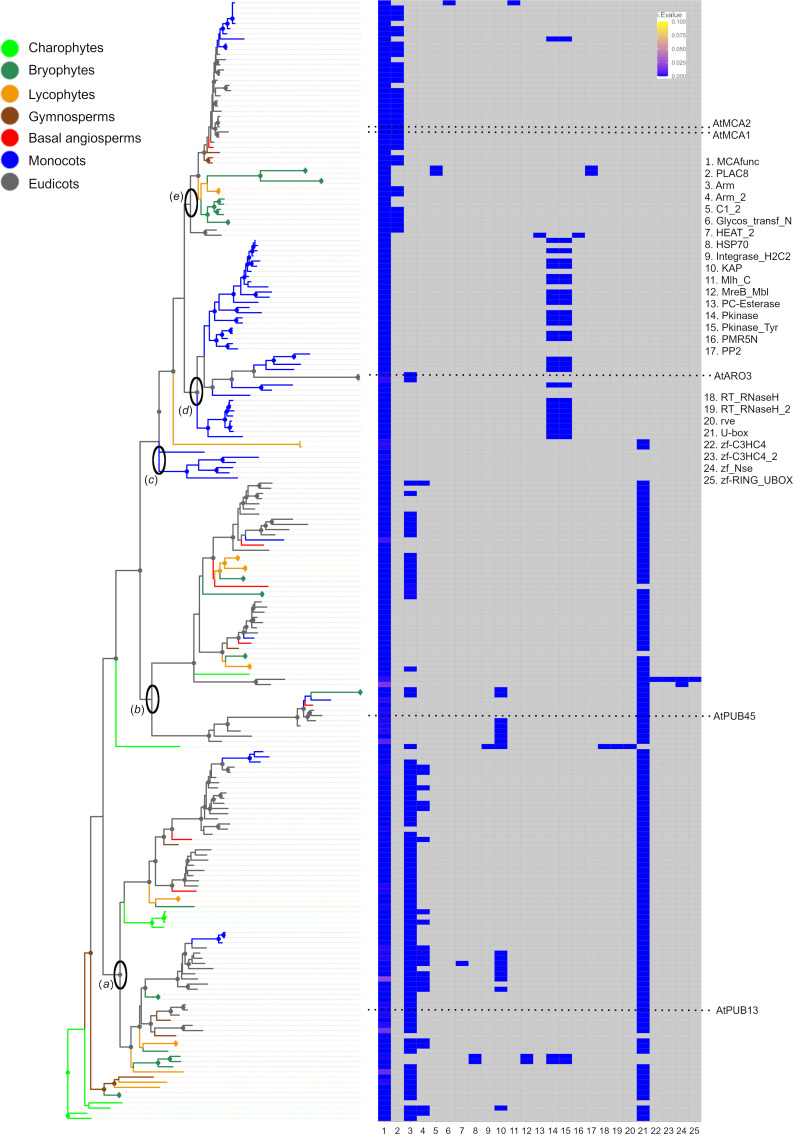
Fig 1. ML tree of MCAfunc domains and their partner domains predicted by HMMER website searches.
Left: ML tree. (a) Clade associated with E3 ubiquitin ligase AtPUB13. (b) Clade associated with AtPUB45. (c) MCAfunc only proteins. (d) Clade associated with AtARO3 and monocot U-box containing protein kinase like proteins. (e) MCA clade. Clades supported with α-LRT SH-like values > 0.8 indicated with circles at the nodes. Right: Domain individual E values (i.Evalue) resulting from HMMER website searches are shown as a heatmap. Absence of domains indicated in grey. The original tree and heatmap are shown in S11 and S16 Appendices. Numbers in legends to the right indicate the domain names (x-axis of the heatmap).

