
Figure 2.
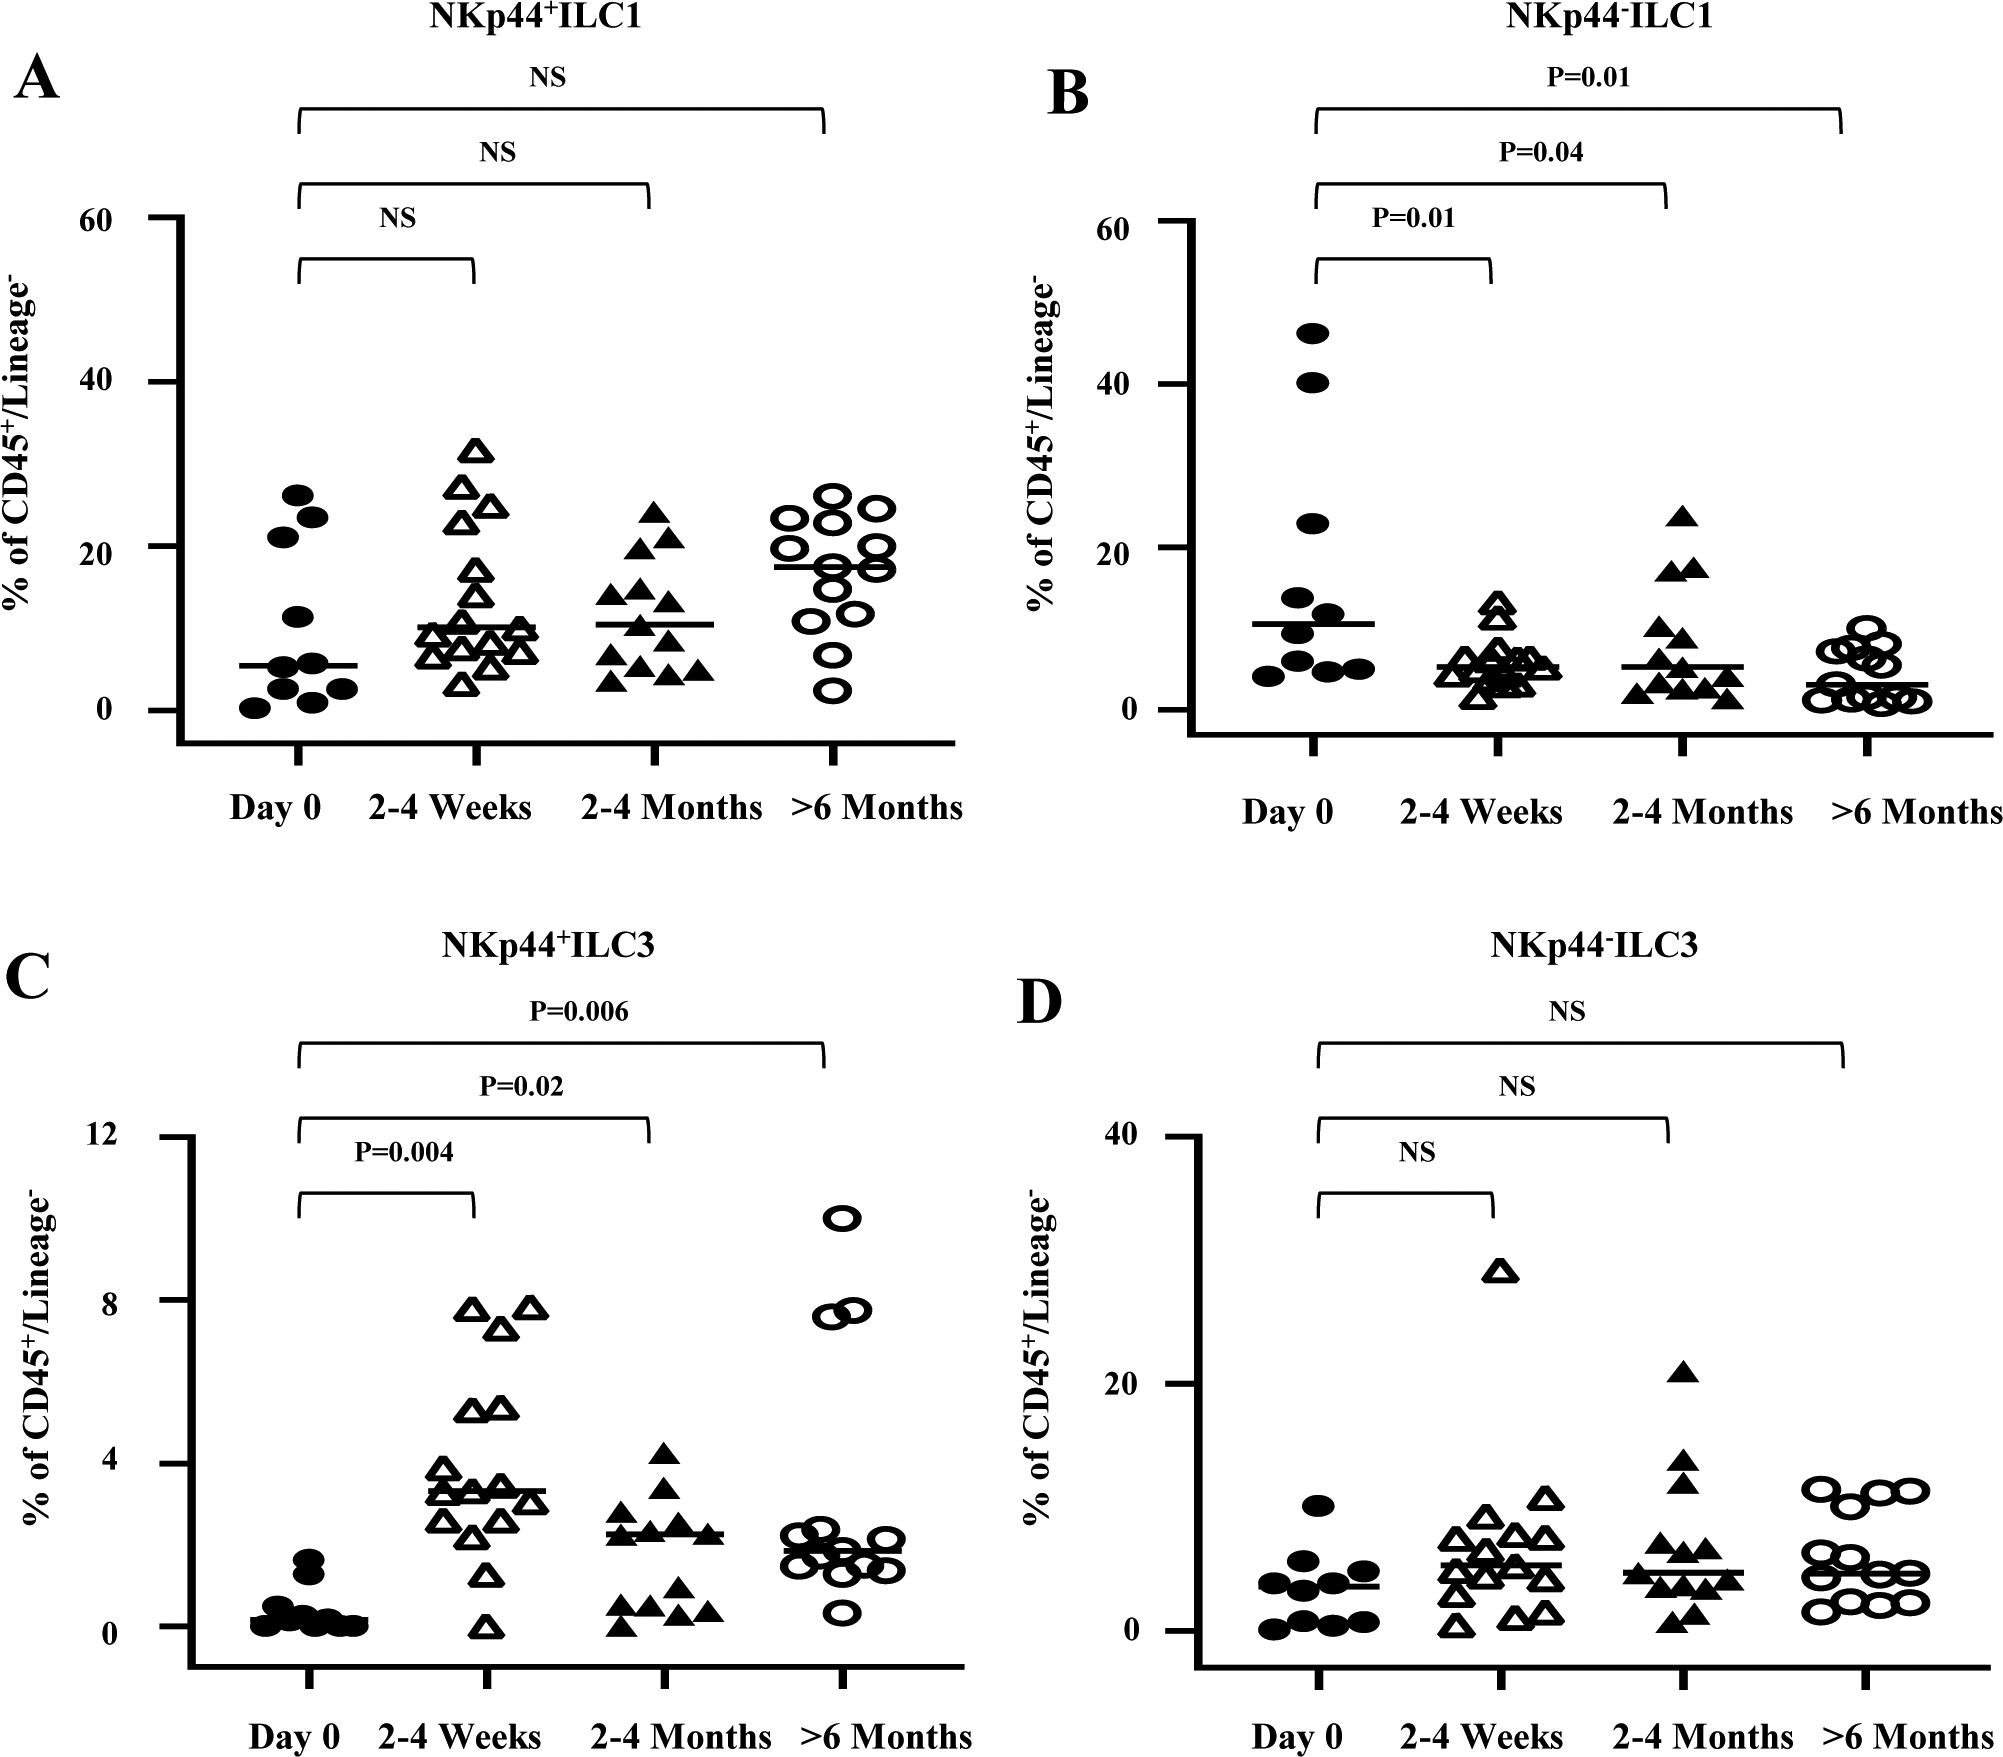
Longitudinal study of change in the frequency of ILC subsets in LP after transplantation. (A-D) Statistical assessment was analyzed by Wilcoxon test for each related sample; NS = not significant. All ILC frequencies are shown as % of CD45+/Lineage−. Sample size is day 0 (n=10), 2–4 weeks (n=15), 2–4 months (n=13) and >6 months (n=13). Each symbol on scatter plots represents the value for a single scope sample from a single subject.