
Figure 3.
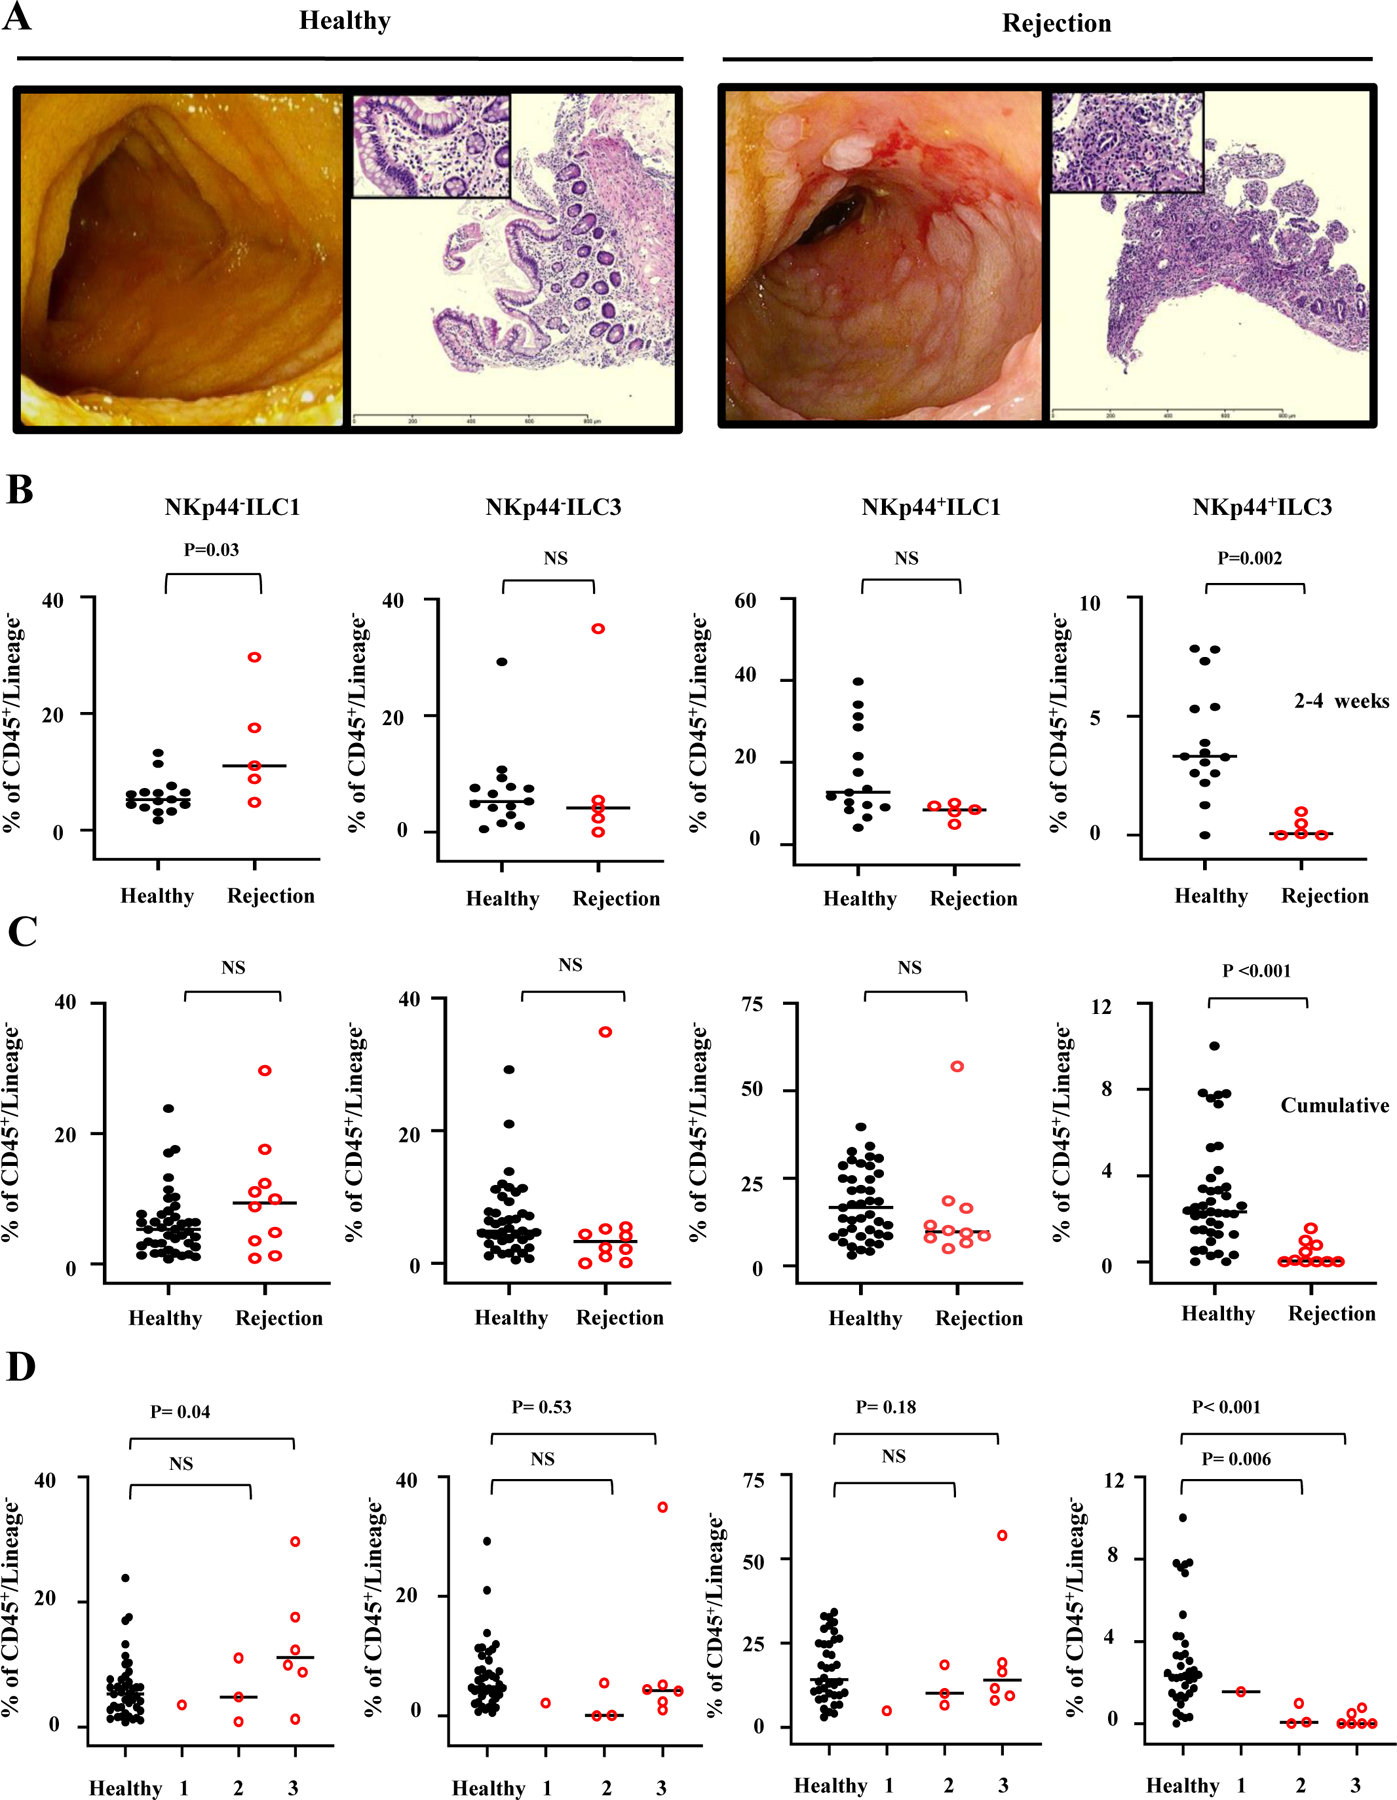
ILC subset composition in healthy versus rejecting ITx allografts. (A) Representative endoscopy and histology of ITx patients with healthy and rejecting allografts. H&E, ×4 (inset, ×40). The slides were visualized on an Olympus BX41 light microscope. (B-D) The rejection biopsies were obtained at the time of diagnosis of rejection and prior to administration of any treatment for rejection. The frequencies of each subset were quantified and compared by Mann-Whitney test (NS = not significant) between healthy controls and rejection patients for (B) 2–4 weeks and (C and D) all cumulative time points. For 2–4 weeks, sample sizes are for healthy allografts n=15 (15 patients) and for rejecting allografts n=5 (5 patients). For all cumulative time points, sample sizes are for healthy allografts n=41 (38 patients) and for rejecting allografts n=10 (10 patients). (D) Scoring system defined as 1 =grade 1 rejection, 2=grade 2 rejection, 3=grade 3 rejection as per pathology consensus guidelines.