
Figure 1:
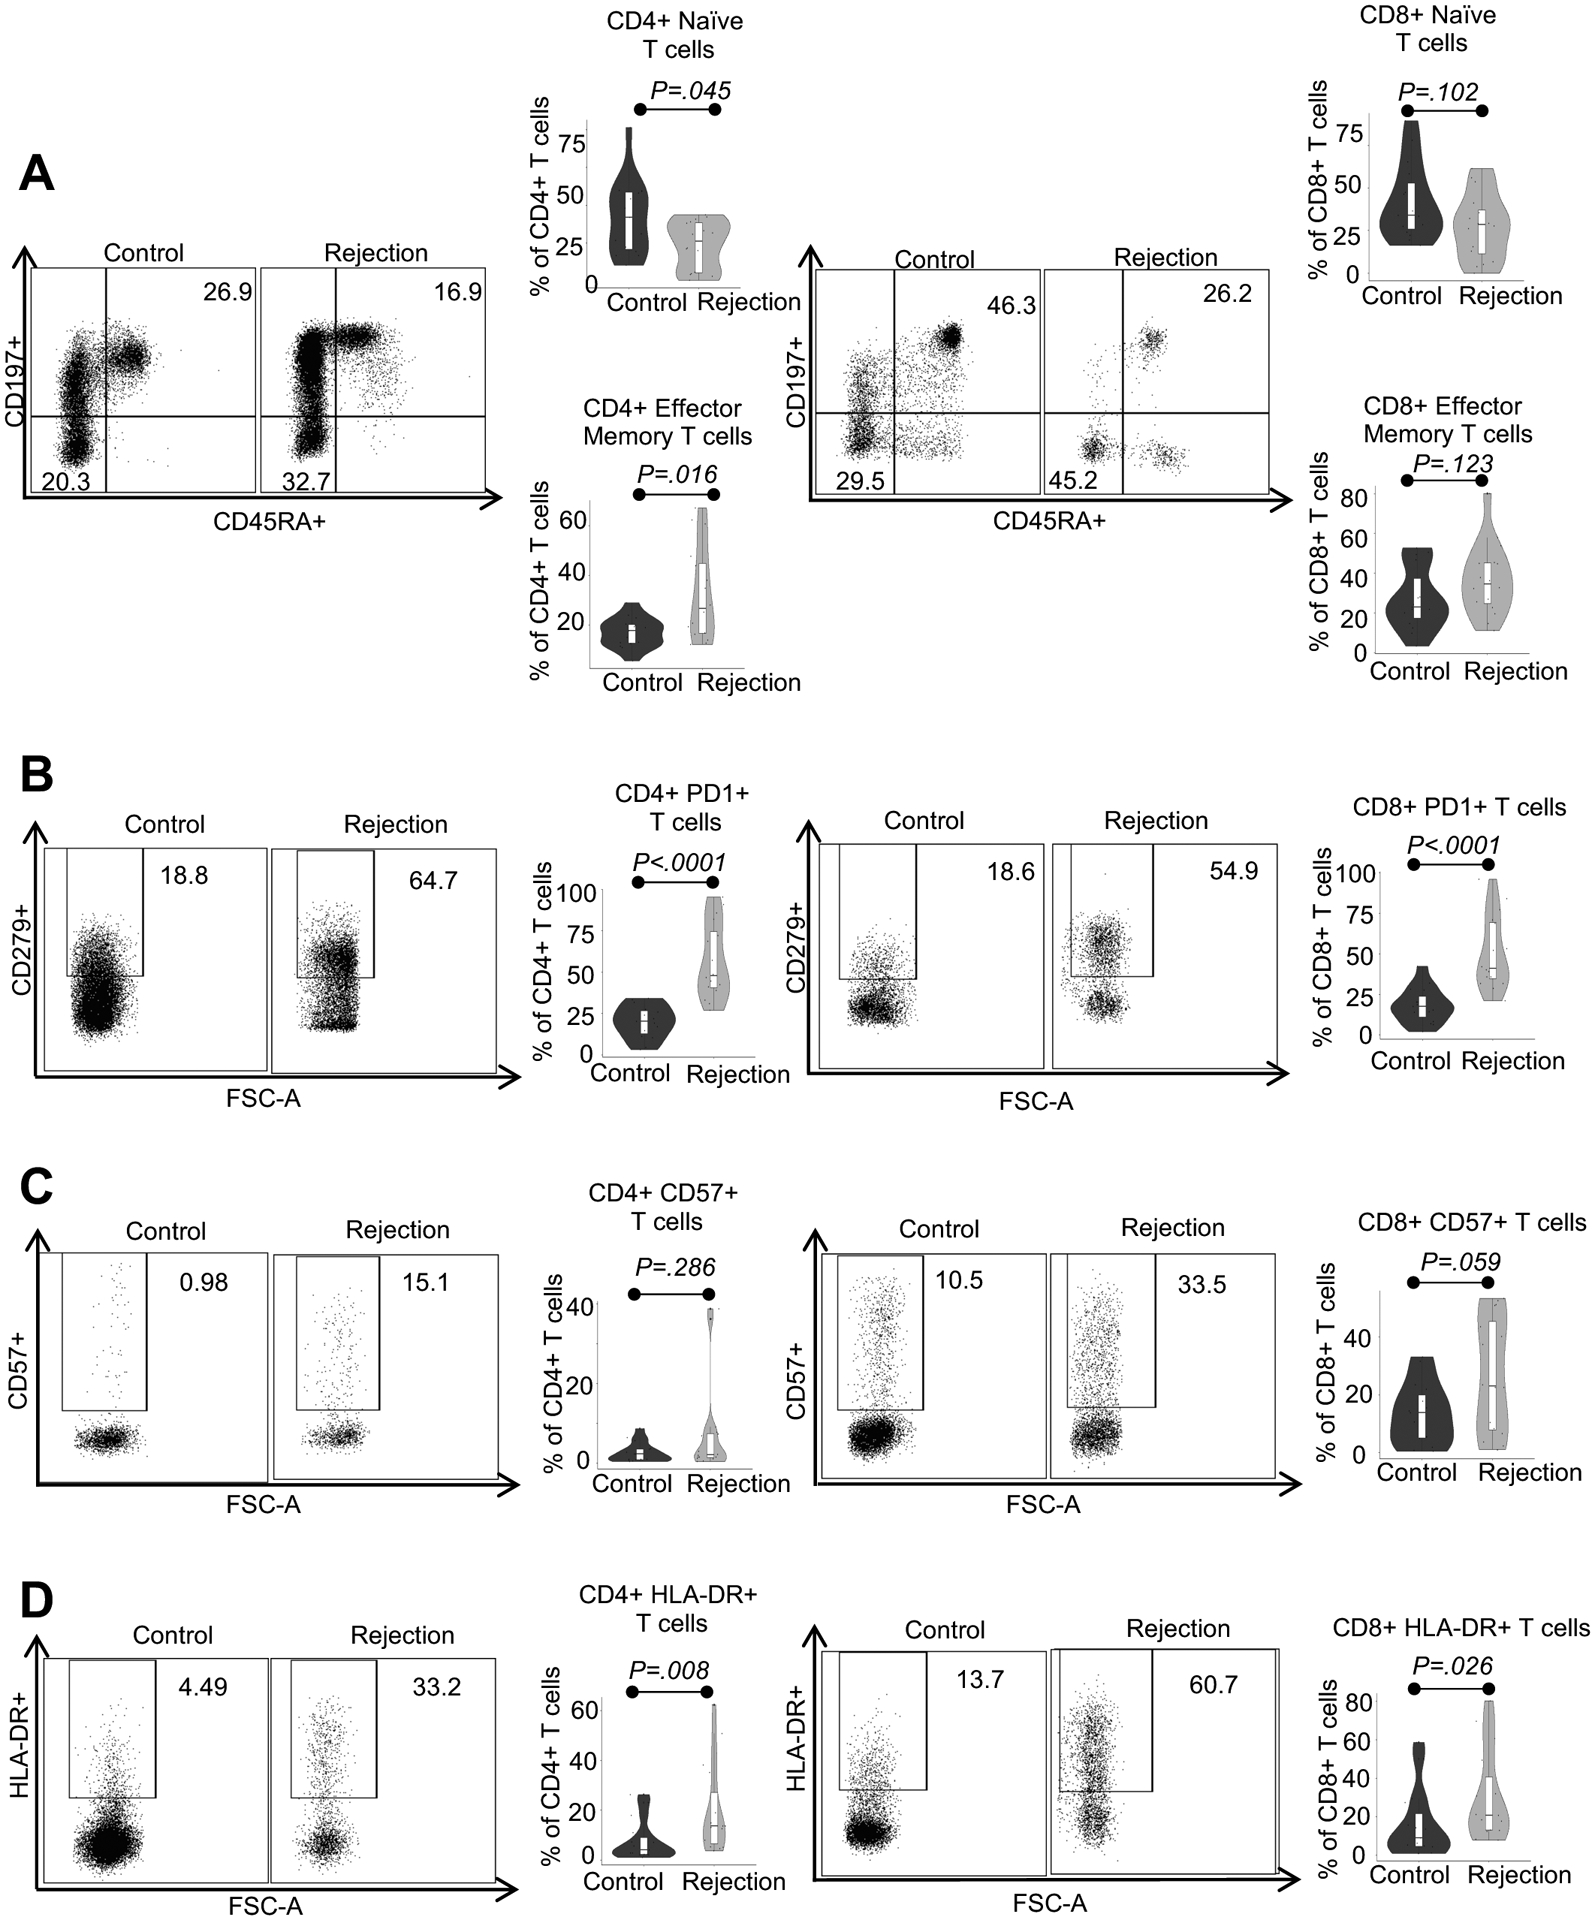
Characterization of peripheral blood T cells from ITx patients with severe rejection (rejector) at the time of rejection diagnosis versus stable controls (non-rejector) via polychromatic flow cytometry. A, B, C, and D) Representative flow plots of alterations in CD4+ (left column) and CD8+ (right column) T cell subpopulations in peripheral blood of non-rejector control versus rejector patients. Violin plots for naive (CD197+CD45RA+), effector memory (CD197-CD45RA), and PD-1, CD57, and HLA-DR expressing subpopulations of CD4+ and CD8+ T cells. Statistics by Wilcoxon rank sum testing. Sample size for all four panel groups is control n=15, rejection n=16.