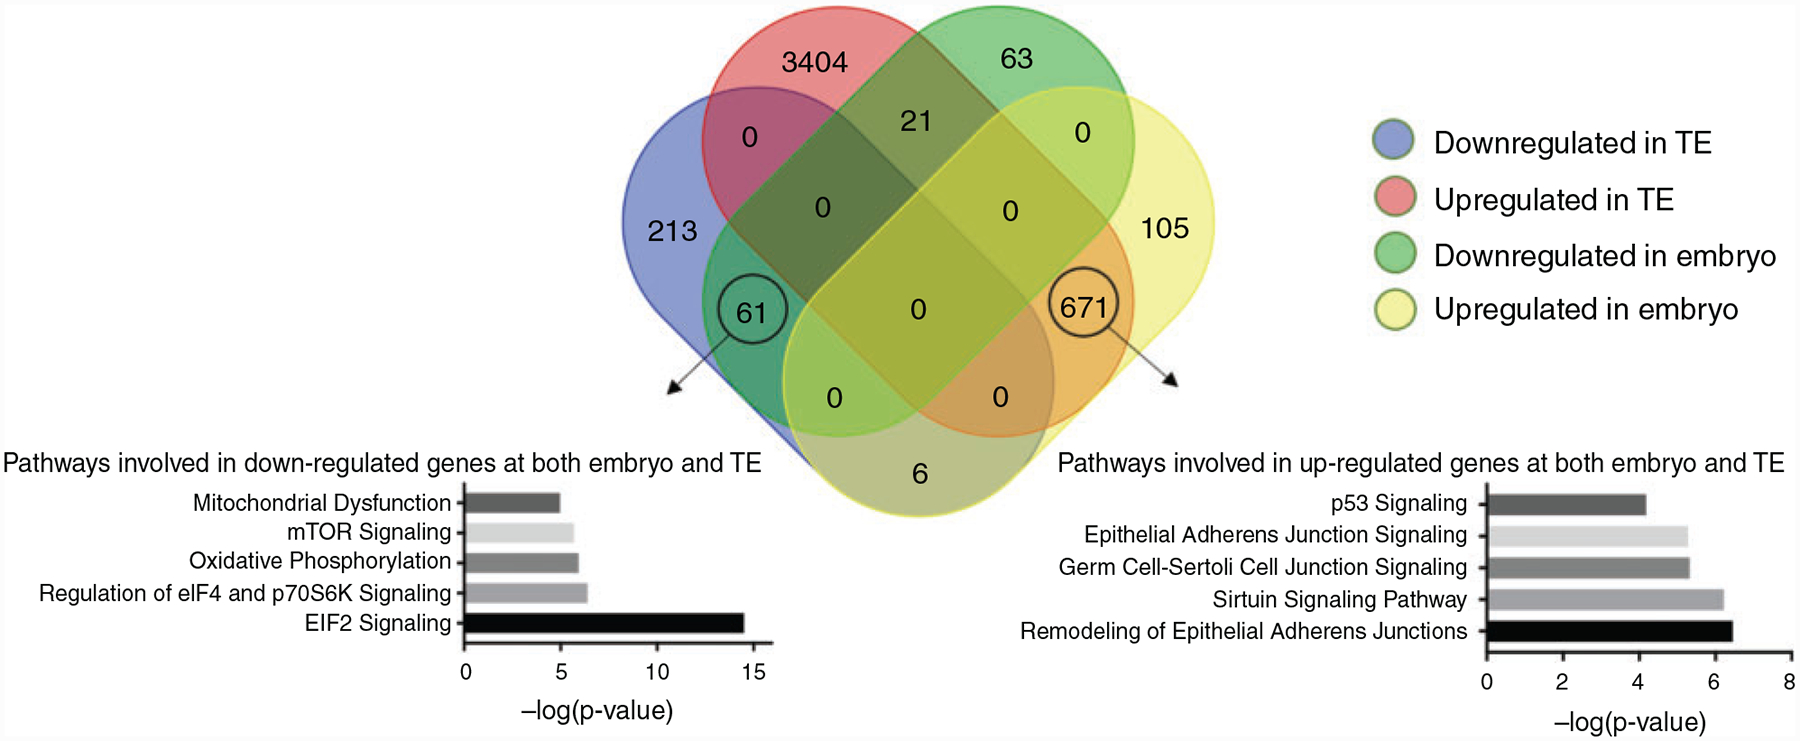
Fig. 4.

Venn diagram showing the numbers of differentially expressed genes between fresh and vitrified D14 embryos and TE. Pathway analysis based on commonly up- and downregulated genes between fresh and vitrified D14 embryos and TE reveals the main regulated pathways.
