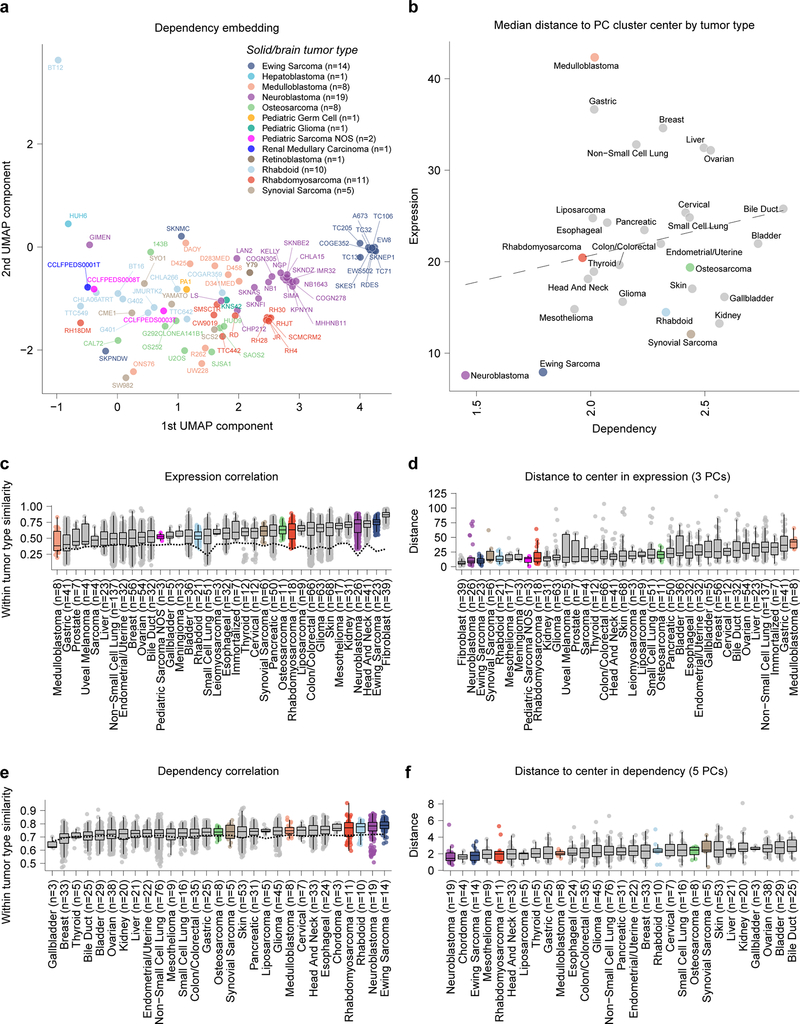
Extended Data Fig. 7. Homogeneity of tumor type in expression space is correlated to homogeneity in dependency space.
a, Two-dimensional representation of selective dependencies using uniform manifold approximation and projection (UMAP) demonstrates clustering of cell lines by tumor type. Each circle represents a cell line with pediatric tumors colored by type and adult tumors not depicted for clarity. b, Median distance from panel (d) (y-axis) compared to median distance from panel (f) (x-axis) demonstrating a trend that tumor types with more homogeneity in expression tend toward more homogeneity in dependency. c, Pairwise Pearson correlation of gene expression of the top 2000 most variable genes across cell line pairs from the same tumor type (y-axis) versus tumor types ordered by median (x-axis). Dotted line represents the median correlation to cell lines not of the same tumor type. d, Distance between each cell line in a tumor type and the center of the tumor type cluster in the first 3 principle components of gene expression of the top 2000 most variable genes (y-axis) versus tumor types ordered by median (x-axis). e, Pairwise Pearson correlation of gene dependency of top 500 most variable dependencies across cell line pairs from the same tumor type (y-axis) versus tumor types ordered by median (x-axis). Dotted line represents median correlation to cell lines not of the same tumor type. f, Distance between each cell line in a tumor type and the center of the tumor type cluster in the first 5 principle components of gene dependency of the top 500 most variable dependencies (y-axis) versus tumor types ordered by median (x-axis). Horizontal lines in panels (c-f) demonstrate the median (center) with minima and maxima box boundaries demonstrating the 25 and 75th percentiles. Upper and lower bounds (whiskers) in panels (c-f) represent the 10 and 90th percentiles respectively.

