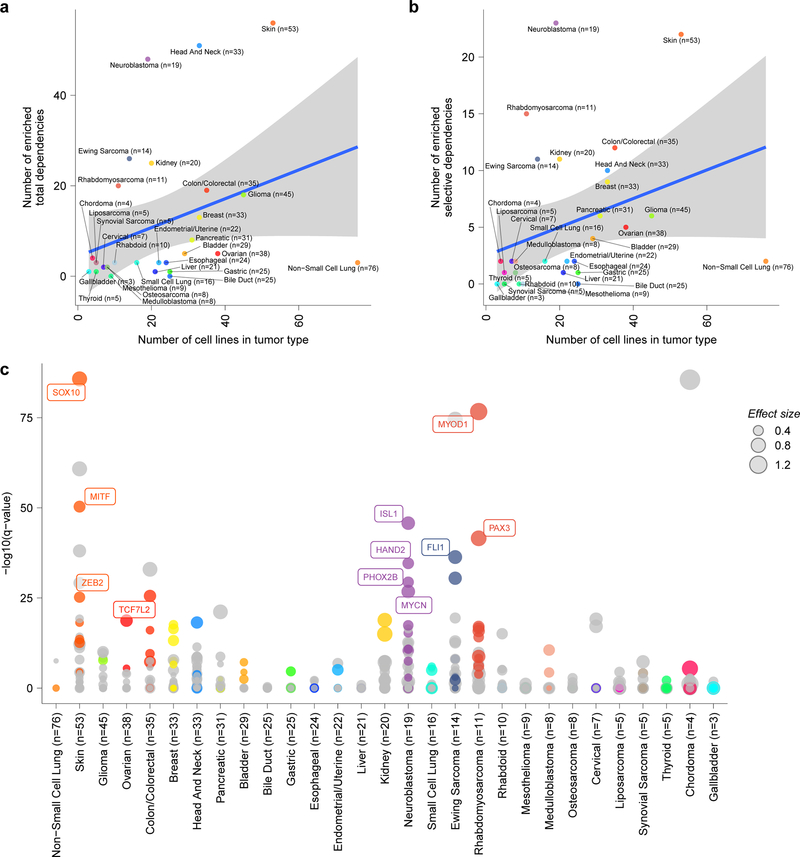
Extended Data Fig. 10. Selective and enriched dependencies in pediatric and adult solid tumor lines.
a, Quantification of tumor type-enriched dependencies per tumor-type (y-axis) compared to number of cell lines screened per tumor type (x-axis). The number of enriched dependencies per tumor type with a q-value <0.05 was calculated by performing a two-class comparison between gene effect scores in each tumor type compared to all other cell lines screened using two-sided t-tests with Benjamini-Hochberg correction. b, Quantification of tumor type-enriched dependencies that are also classified as selective dependencies in the screen per tumor-type (y-axis) compared to number of cell lines screened per tumor type (x-axis). The number of enriched dependencies per tumor type with a q-value <0.05 was calculated by performing a two-class comparison between gene effect scores in each tumor type compared to all other cell lines screened using two-sided t-tests with Benjamini-Hochberg correction. Each circle in panels (a-b) represents a tumor type colored as in the legend. The blue lines in panels (a-b) represent a linear model fit to this data with the gray shaded area representing the 95% confidence interval around the fit. c, Tumor type-enriched dependencies in all solid and brain tumor types with more than 2 cell lines. Plotted on the y-axis is -log10 of the q-value of enrichment as calculated by performing a two-class comparison between gene effect scores in each tumor type compared to all other cell lines screened using two-sided t-tests with Benjamini-Hochberg correction. Tumor types are plotted along the x-axis. The size of the circles reflects the mean difference in dependency score between the tumor type and all other cell lines screened. Gray circles are enriched dependencies in a tumor type that are not classified as transcription factors and colored circles are transcription factor dependencies in the screen.

