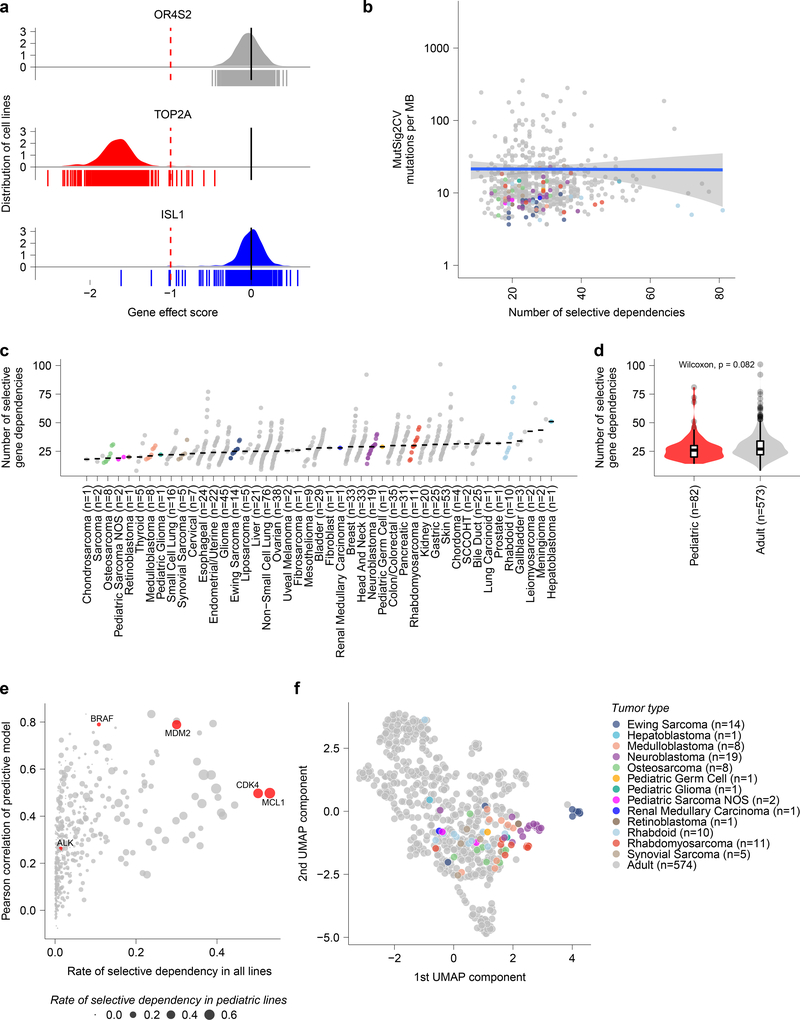
Fig 2. Cancer cell line selective dependencies are not correlated with mutation burden.
a, Example score distributions of genes that were non-essential (OR6S1), common essential (TOP2A), and a selective dependency (ISL1, with normLRT of 290) in the genome-scale CRISPR-Cas9 screen. The y-axis represents the cell line distribution with the x-axis representing CRISPR gene effect scores. Individual scores for cell lines screened (n=612) are indicated by the symbols depicted below the x-axis. b, Mutational burden as detected by whole exome sequencing by MutSig2CV in mutations per megabase (MB) compared to the number of selective dependencies per cell line in the screen. The y-axis depicts mutation rate per cell line and the x-axis the number of selective dependencies per cell line. The circles represent individual cell lines with type colored as in panel (c). The blue line represents a linear model fit to this data with Pearson correlation 0.01 with the gray shaded area representing the 95% confidence interval around the fit. c, Number of selective gene dependencies per cell line (on y-axis) grouped by tumor type ordered by median (x-axis). Each circle represents an individual cell line with pediatric tumors colored by type; the black line represents the median number of dependencies per tumor type. d, Pediatric solid and brain tumor cell lines (red, n=82 biologically independent cell lines) did not have a statistically different distribution of selective dependencies (y-axis) as a whole compared to adult solid tumor lines (gray, n=573 biologically independent cell lines) by two-sided Wilcoxon test. Horizontal lines demonstrate the median (center) with minima and maxima box boundaries demonstrating the 25 and 75th percentiles. Upper and lower bounds (whiskers) represent the 10 and 90th percentiles respectively. e, Predictive modeling of selective dependencies across all solid and brain tumor cell lines. The y-axis depicts the Pearson correlation of the predictive model for dependency on a gene, and the x-axis shows fraction of cancer cell lines that are dependent on a gene. The size of the points corresponds to the fraction of pediatric cancer cell lines that are dependent on a gene. The red color highlights examples of genes that pediatric cancers are frequently dependent on (MCL1, CDK4), genes with strong predictive models (BRAF, MDM2), or genes with low rates of dependency and poor predictive models (ALK). f, Two-dimensional representation of selective dependencies (removing genes that did not have dependency scores for all cell lines screened) using uniform manifold approximation and projection (UMAP) demonstrates strong clustering of Ewing sarcoma, neuroblastoma and rhabdomyosarcoma by tumor type. Each circle represents a cell line with pediatric tumors colored by type.

