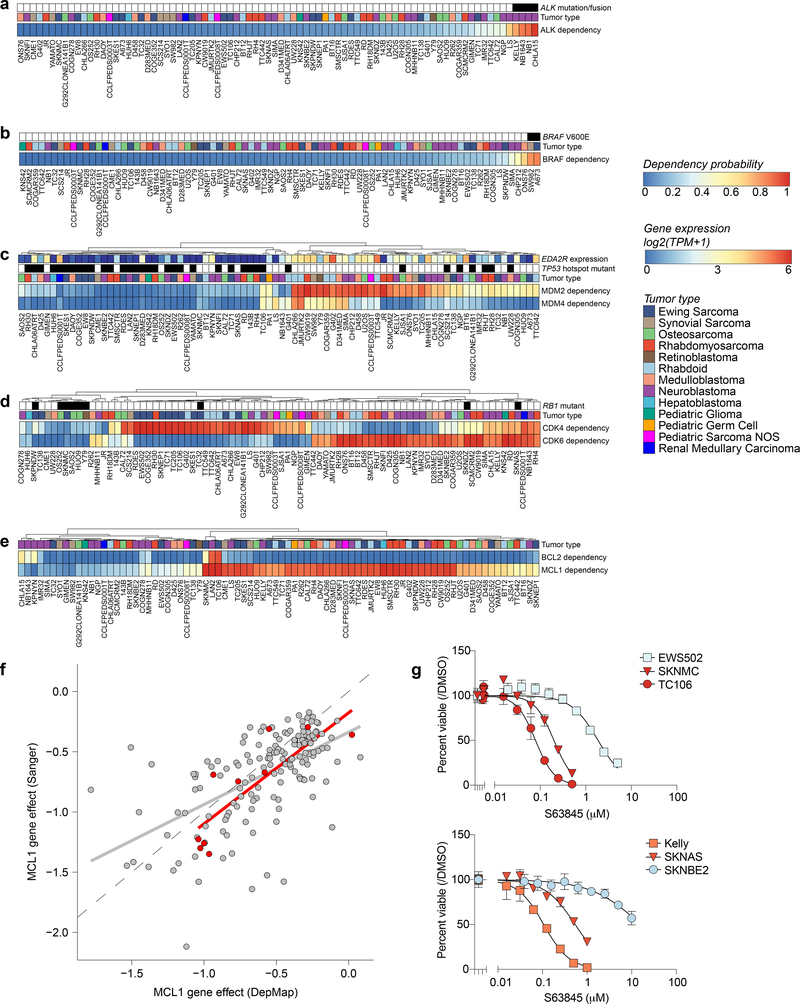
Fig 3. Genetic dependencies and potential therapeutic targeting.
For each genetic dependency, the heatmap indicates the probability of dependency of each cell line with a probability greater than 0.5 considered dependent. When multiple genes are plotted per heatmap, hierarchical clustering was performed. a, Three pediatric solid tumor cell lines demonstrate mutations or fusions in ALK and these cell lines are among the most dependent on ALK. Of note, the neuroblastoma cell line NB1 is also dependent on ALK and harbors an amplification of the gene. b, Two pediatric solid tumor cell lines demonstrate BRAF V600E mutations and these cell lines are BRAF dependent. c, Correlation between MDM2 and/or MDM4 dependency and TP53 hotspot mutations as well as EDA2R expression. d, RB1 mutation status is predictive of CDK4 or CDK6 dependency. Depicted here are all RB1 mutations. TC32 is known to have a heterozygous mutation in RB1 and thus has functional RB1. e, Neuroblastoma cell lines demonstrate dependency on BCL2 while the majority of pediatric solid tumor cell lines are dependent on MCL1. f, Correlation of MCL1 gene effect scores for overlapping cell lines DepMap 20Q1 and Sanger genome-scale CRISPR-Cas9 screen with an independent guide library. Adult cancer cell lines are colored gray while pediatric cancer cell lines are red. The gray and red line represent a linear model fit to the adult or pediatric data. g, Treatment with S63845, a selective MCL1 inhibitor, for four days in Ewing sarcoma (top) and neuroblastoma (bottom) cell lines demonstrates relative sensitivity consistent with dependency scores. The y-axis represents percent viable cells as compared to controls treated with DMSO for each experiment. The x-axis represents concentrations of inhibitor (μM). The data points for each cell line are colored by the probability of dependency on MCL1 with the same colors as the heatmap in (e). One representative experiment is shown for each cell line; each was performed in triplicate (n=3). Data are presented as mean values +/− standard error of mean (SEM).

