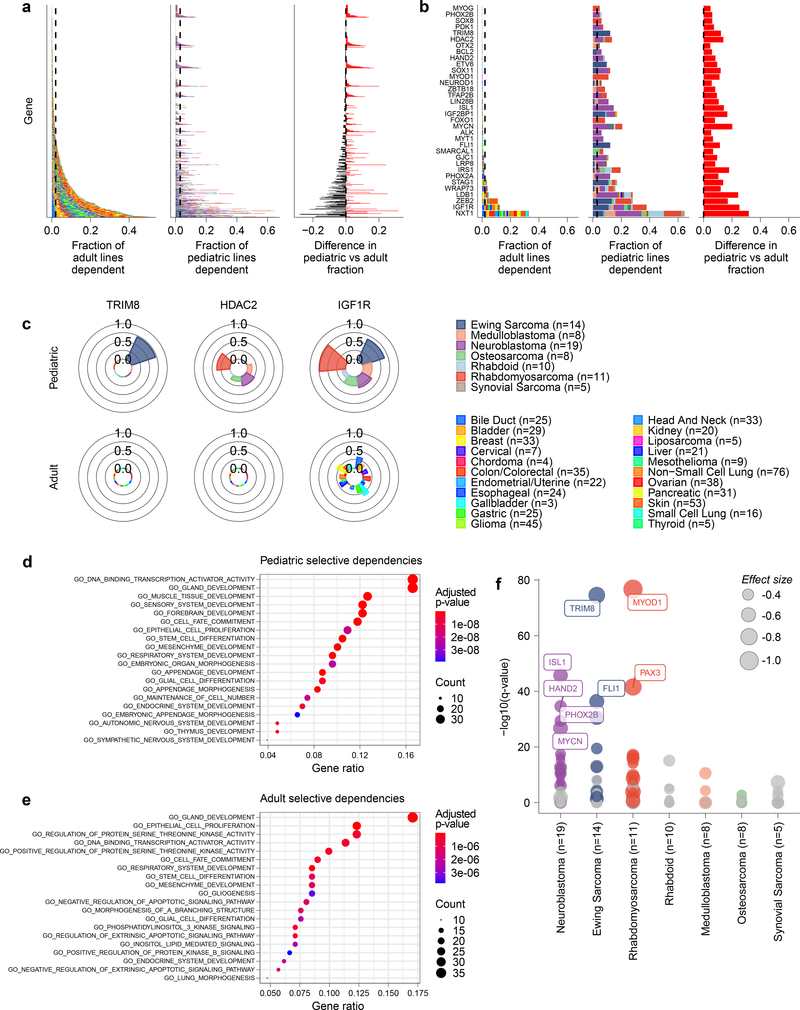
Fig 4. Selective dependencies in pediatric and adult solid tumor lines.
a, Selective dependency genes demonstrate subsets that are more common in pediatric compared to adult cancer cell lines. Each row on the y-axis represents one of the selective dependencies (removing common essential and non-essential genes) ordered across the three subpanels by rate of dependency seen in adult cancer cell lines. The left subpanel shows the rate at which adult cell lines are dependent (x-axis) and the center subpanel shows the rate at which pediatric cancer cell lines are dependent (x-axis). The right subpanel demonstrates the difference in rate of dependency in pediatric versus adult cancer cell lines (x-axis) with dependencies seen at greater frequency in pediatric cell lines colored red and those seen more frequently in adult cell lines as black. The bars in the center and right panels are colored by the contribution of each tumor type as shown in the legend. b, Thirty-four selective dependencies were significantly more common in the pediatric cell lines compared to adult cell lines (adjusted p-value <0.05 by two-sided Fisher’s exact test with Benjamini-Hochberg correction). The subpanels are arranged and colored as in panel (a). Notably, several selective dependencies were not seen in adult solid tumor cell lines and were unique to pediatric solid tumors. c, The frequency of dependency on TRIM8, HDAC2 and IGF1R are depicted in pediatric and adult solid tumor types with at least 3 cell lines screened per type in polar bar graphs. The heights of the bars correspond to the fraction of cell lines of a particular tumor type that are dependent on the gene. The tumor types are colored as in the legend. TRIM8 dependency was seen uniquely in Ewing sarcoma and no other tumor types screened. HDAC2 dependency was seen only in pediatric cell lines but across several tumor types in contrast to none of the adult solid tumor lines. IGF1R dependency was seen across adult and pediatric solid tumors but with greater frequency in pediatric tumors. d, Gene set enrichment analysis (GSEA) of selective dependencies present in >2% of pediatric cell lines using the gene ontology C5 collection from MSigDB identifies enrichment of developmental pathways. On the y-axis are the 20 gene sets with the highest overlap with the query set, plotted on the x-axis. e, GSEA of selective dependencies present in >2% of adult cancer cell lines using the C5 collection demonstrates enrichment of several signaling pathways. On the y-axis are the 20 gene sets with the highest overlap with the query set, plotted on the x-axis. f, Tumor type-enriched dependencies in pediatric tumor types with more than 2 cell lines. Plotted on the y-axis is -log10 of the q-value of enrichment as calculated by performing a two-class comparison between gene effect scores in each tumor type compared to all other cell lines screened using two-sided t-tests with Benjamini-Hochberg correction. Pediatric tumor types are plotted along the x-axis. The size of the circles reflects the mean difference in dependency score between the tumor type and all other cell lines screened. Gray circles are enriched dependencies in a tumor type that are not classified as selective and colored circles are selective dependencies in the screen.

