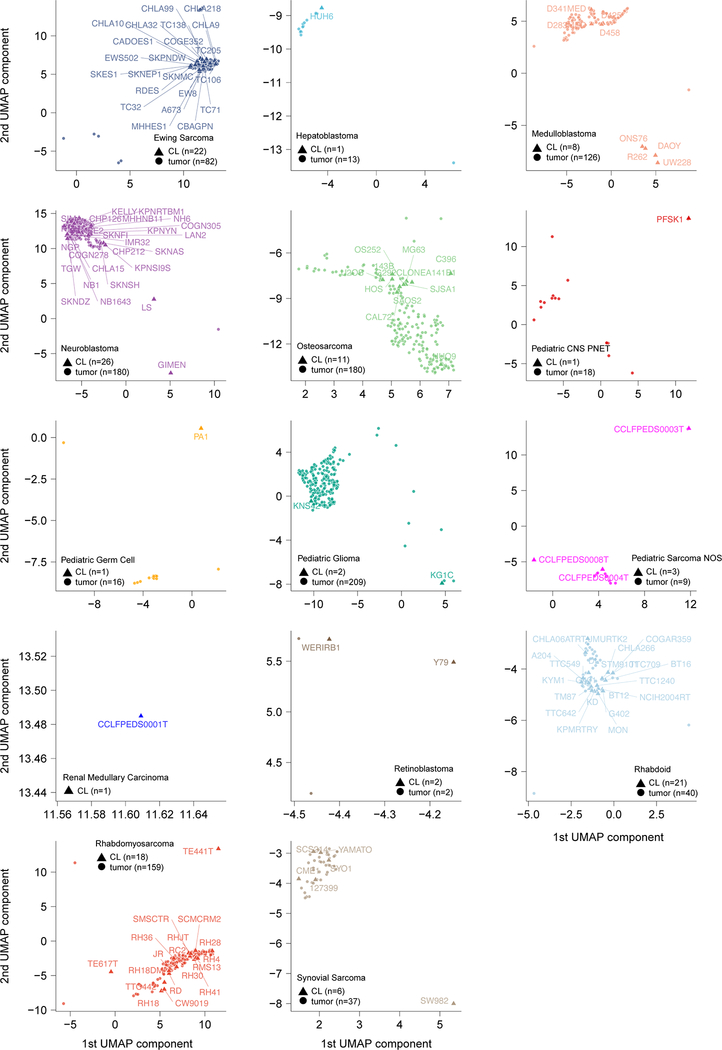
Extended Data Fig 1. Pediatric solid tumor cancer models represent primary tumors.
Two-dimensional representation of RNA-sequencing data using uniform manifold approximation and projection (UMAP) following alignment by Celligner for all primary tumors (triangles) and cancer cell lines (circles) with each cancer type separated for clarity. Cell line names are labelled.

