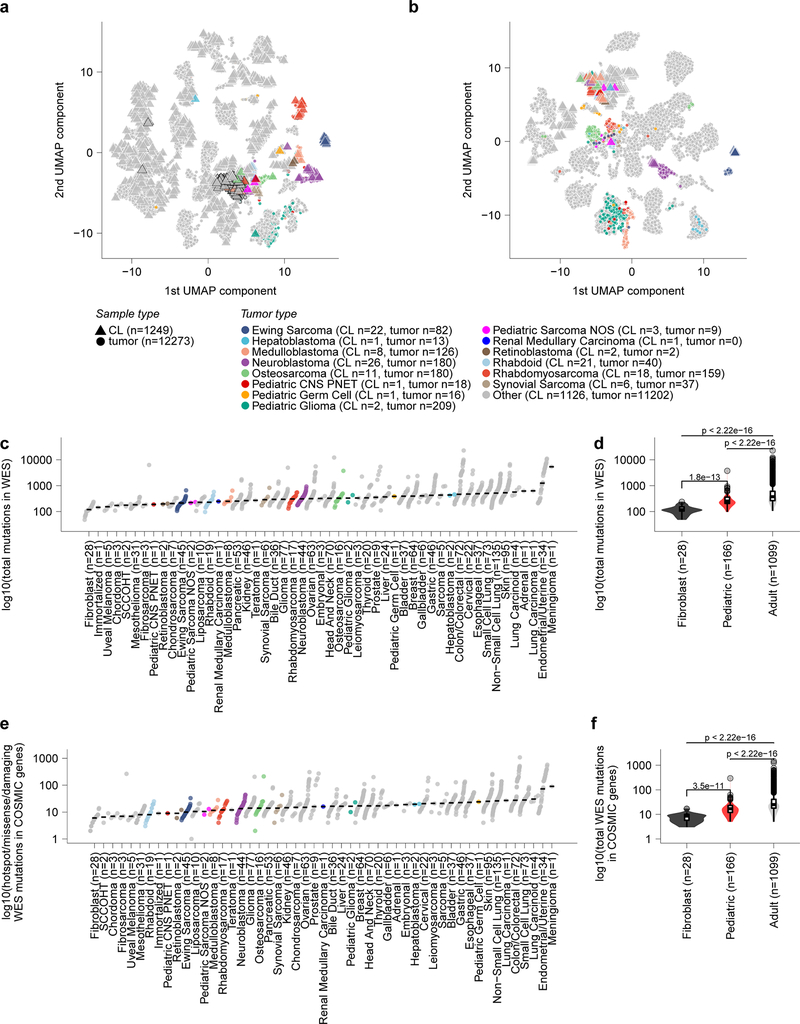
Extended Data Fig 2. Pediatric solid tumor cancer models represent high-risk disease.
a, Two-dimensional representation of RNA-sequencing data using uniform manifold approximation and projection (UMAP) after alignment by Celligner for primary tumors (triangles) and cancer cell lines (circles). Cell lines and primary tumors that were classified as belonging to the undifferentiated cluster are outlined by a black border. b, Two-dimensional representation of RNA-sequencing data using UMAP prior to alignment by Celligner for primary tumors (triangles) and cancer cell lines (circles). c, The total count of mutations in whole exome sequencing (WES) (y-axis) grouped by solid tumor type (x-axis) with diseases ordered by median burden. d, Number of mutations in WES (y-axis) of pediatric solid tumor cell lines (red, n=166 biologically independent cell lines) compared to adult solid tumor (gray, n=1099 biologically independent cell lines) (p<2.22e−16 by two-sided Wilcoxon test) and fibroblast cell lines (black, n=28 biologically independent cell lines) (p=1.8e−13). e, The count of mutations in WES filtered to only include hotspot, missense or damaging mutations in COSMIC genes (y-axis) grouped by solid tumor type (x-axis) with diseases ordered by median burden. Each circle in panels (c, e) represents an individual cell line with pediatric tumors colored by type; the black line represents the median mutation burden per tumor type. f, Mutations in WES filtered to only include hotspot, missense or damaging mutations in COSMIC genes (y-axis) of pediatric solid tumor cell lines (red, n=166 biologically independent cell lines) compared to adult solid tumor (gray, n=1099 biologically independent cell lines) (p<2.22e−16 by two-sided Wilcoxon test) and fibroblast cell lines (black, n=28 biologically independent cell lines) (p=3.5e−11). Horizontal lines in panels (d, f) demonstrate the median (center) with minima and maxima box boundaries demonstrating the 25 and 75th percentiles. Upper and lower bounds (whiskers) in panels (d, f) represent the 10 and 90th percentiles respectively.

