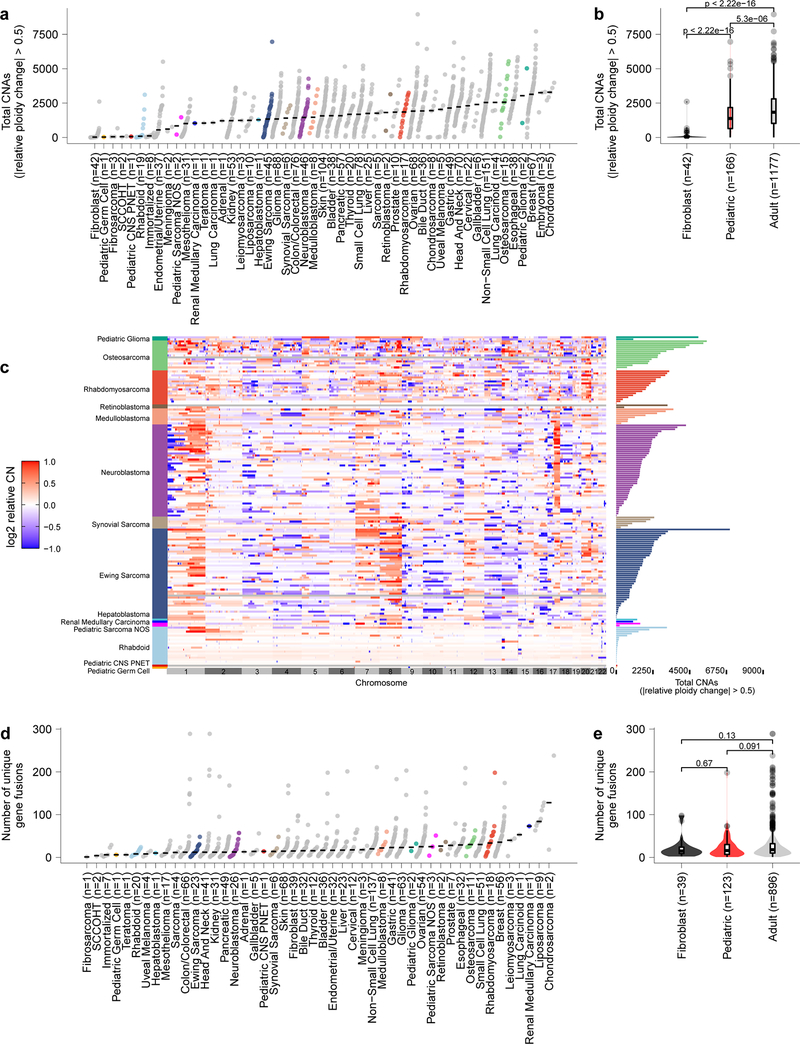
Extended Data Fig. 3. Pediatric solid tumors have fewer total copy number events and gene fusions than adult tumor cell lines with expected profiles for disease subtypes.
a, Total number of genes with copy number alterations (CNA) as identified by genes that had a relative change in ploidy of 0.5 is plotted on the y-axis with tumor types along the x-axis. Each circle represents an individual cell line with pediatric tumors colored by type; the black line represents the median number of CNAs per tumor type. Of note, rhabdoid tumors have very few CNAs, consistent with primary patient tumors. b, CNAs (y-axis) in pediatric solid tumor cell lines (red, n=166 biologically independent cell lines) compared to adult solid tumor (gray, n=1177 biologically independent cell lines) (p=5.3e−06 by two-sided Wilcoxon test) and fibroblast cell lines (black, n=42 biologically independent cell lines) (p<2.22e−16). c, Copy number heatmap across the genome for pediatric cancer cell lines demonstrates multiple CNAs in osteosarcoma as expected with few events in rhabdoid tumors. d, Total number of genes fusions per cell line from RNA sequencing is plotted on the y-axis with tumor types along the x-axis. Each circle represents an individual cell line with pediatric tumors colored by type; the black line represents the median number of gene fusions per tumor type. Of note, osteosarcoma cell lines have high numbers of gene fusions, consistent with primary patient tumors. e, Gene fusion calls from RNA sequencing (y-axis) in pediatric solid tumor cell lines (red, n=123 biologically independent cell lines) compared to adult solid and brain tumor (gray, n=896 biologically independent cell lines) and fibroblast cell lines (black, n=39 biologically independent cell lines) by two-sided Wilcoxon test. Horizontal lines in panels (b, e) demonstrate the median (center) with minima and maxima box boundaries demonstrating the 25 and 75th percentiles. Upper and lower bounds (whiskers) in panels (b, e) represent the 10 and 90th percentiles respectively.

