
FIGURE 2.
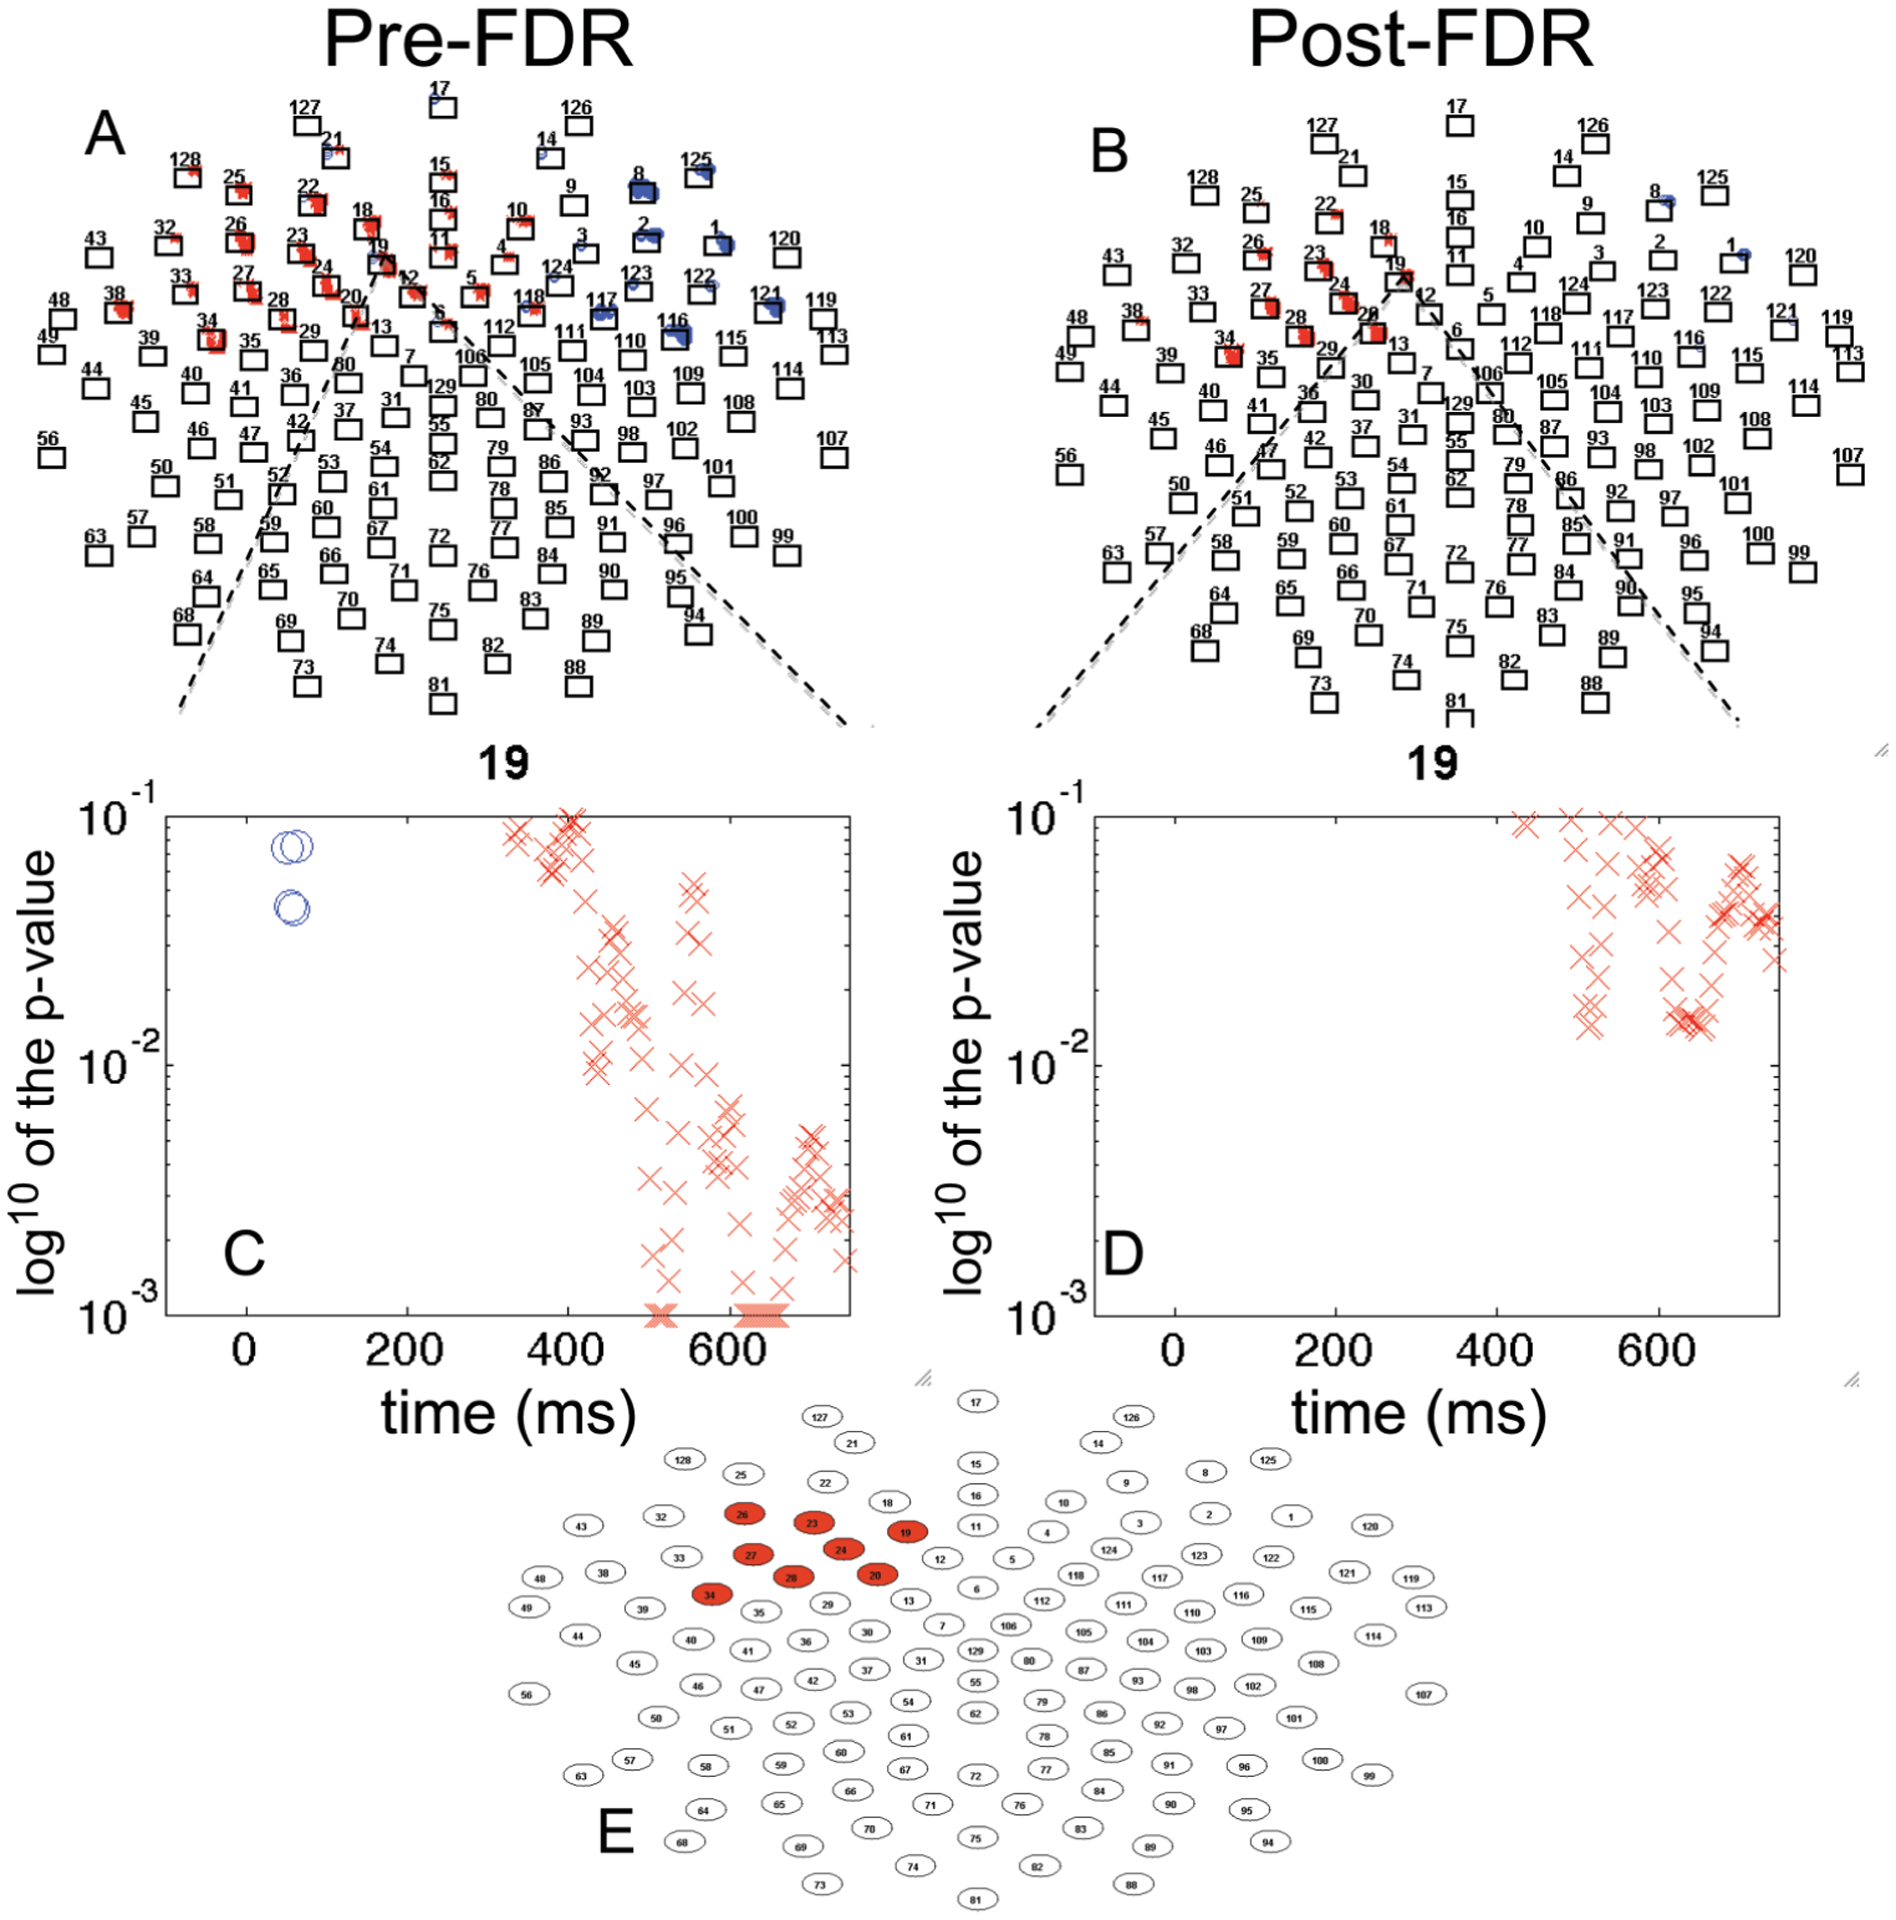
Analysis of the Cue Avoidance Task for frontal channels. (A) significant mass univariate t-tests plotted by p-value × time, p < .05; (B) false discovery rate (FDR) corrected univariate t-tests plotted by p-value by time; (C) single channel mass univariate t-tests plotted by p-value × time; (D) single channel FDR-corrected univariate t-tests plotted p-value × time; (E) channels remaining significant post-FDR (Approach A). [blue “o” indicates positive t-value; red “x” indicates negative t-value; p-value higher than 0.1 is not plotted; p-value lower than 0.001 is plotted on the 0.001 line].