


FIGURE 4.
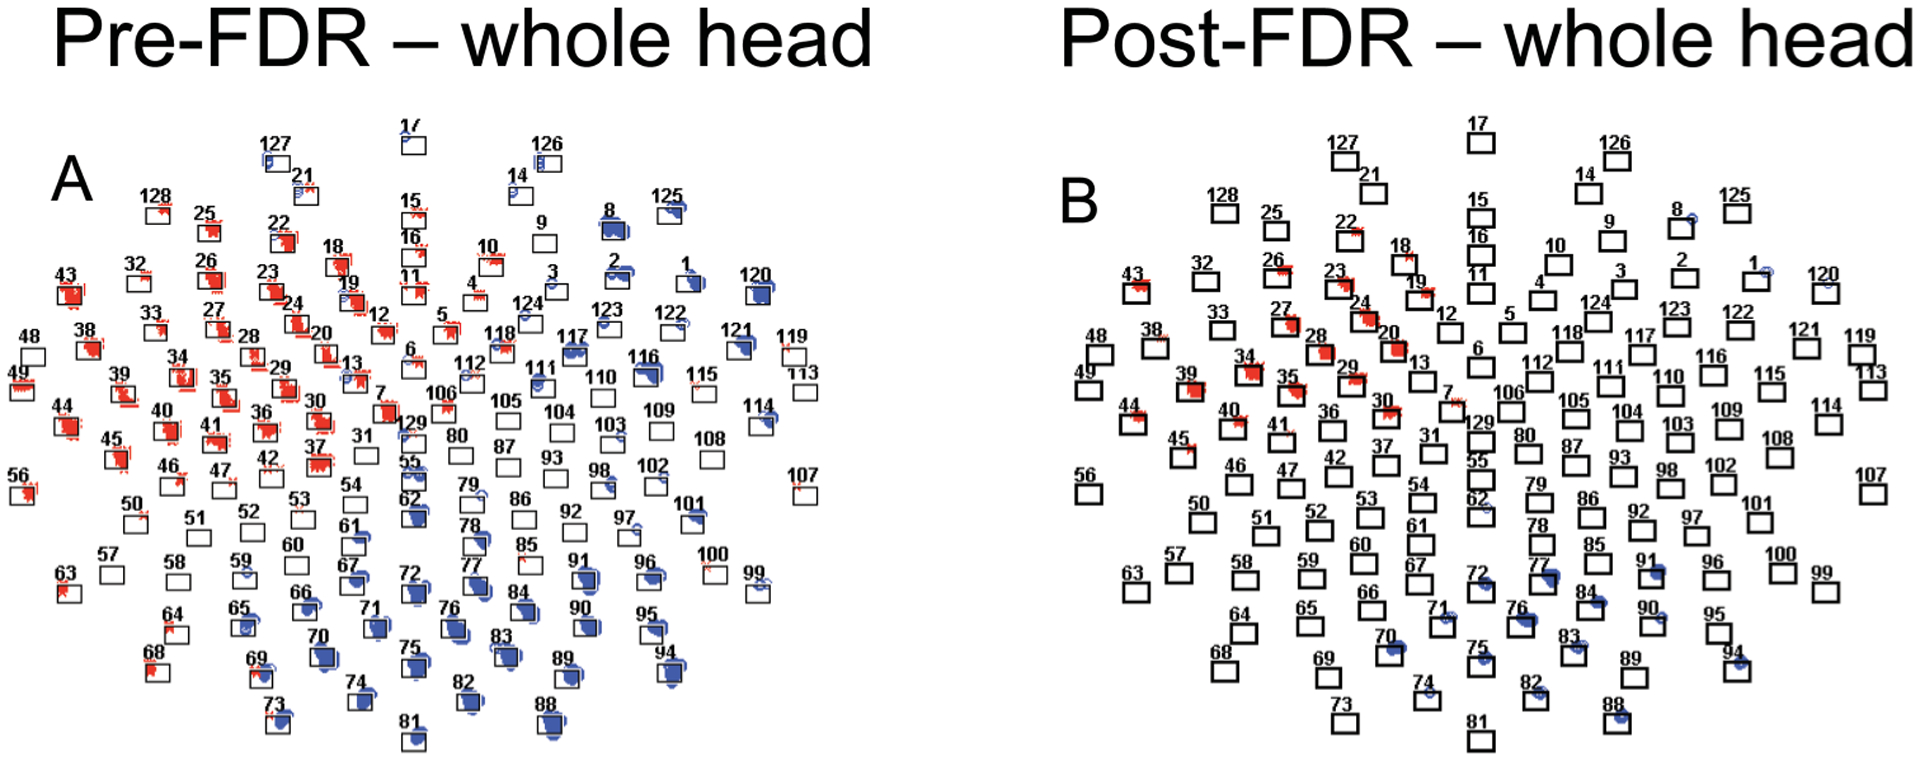
Analysis of the Cue Avoidance Task for the whole head. (A) significant mass univariate t-tests plotted by p-value × time, p < .05; (B) FDR-corrected univariate t-tests plotted by p-value by time; blue “o” indicates positive t-value; red “x” indicates negative t-value. The shaded area indicates those electrodes that emerged from the analysis of the frontal region only.