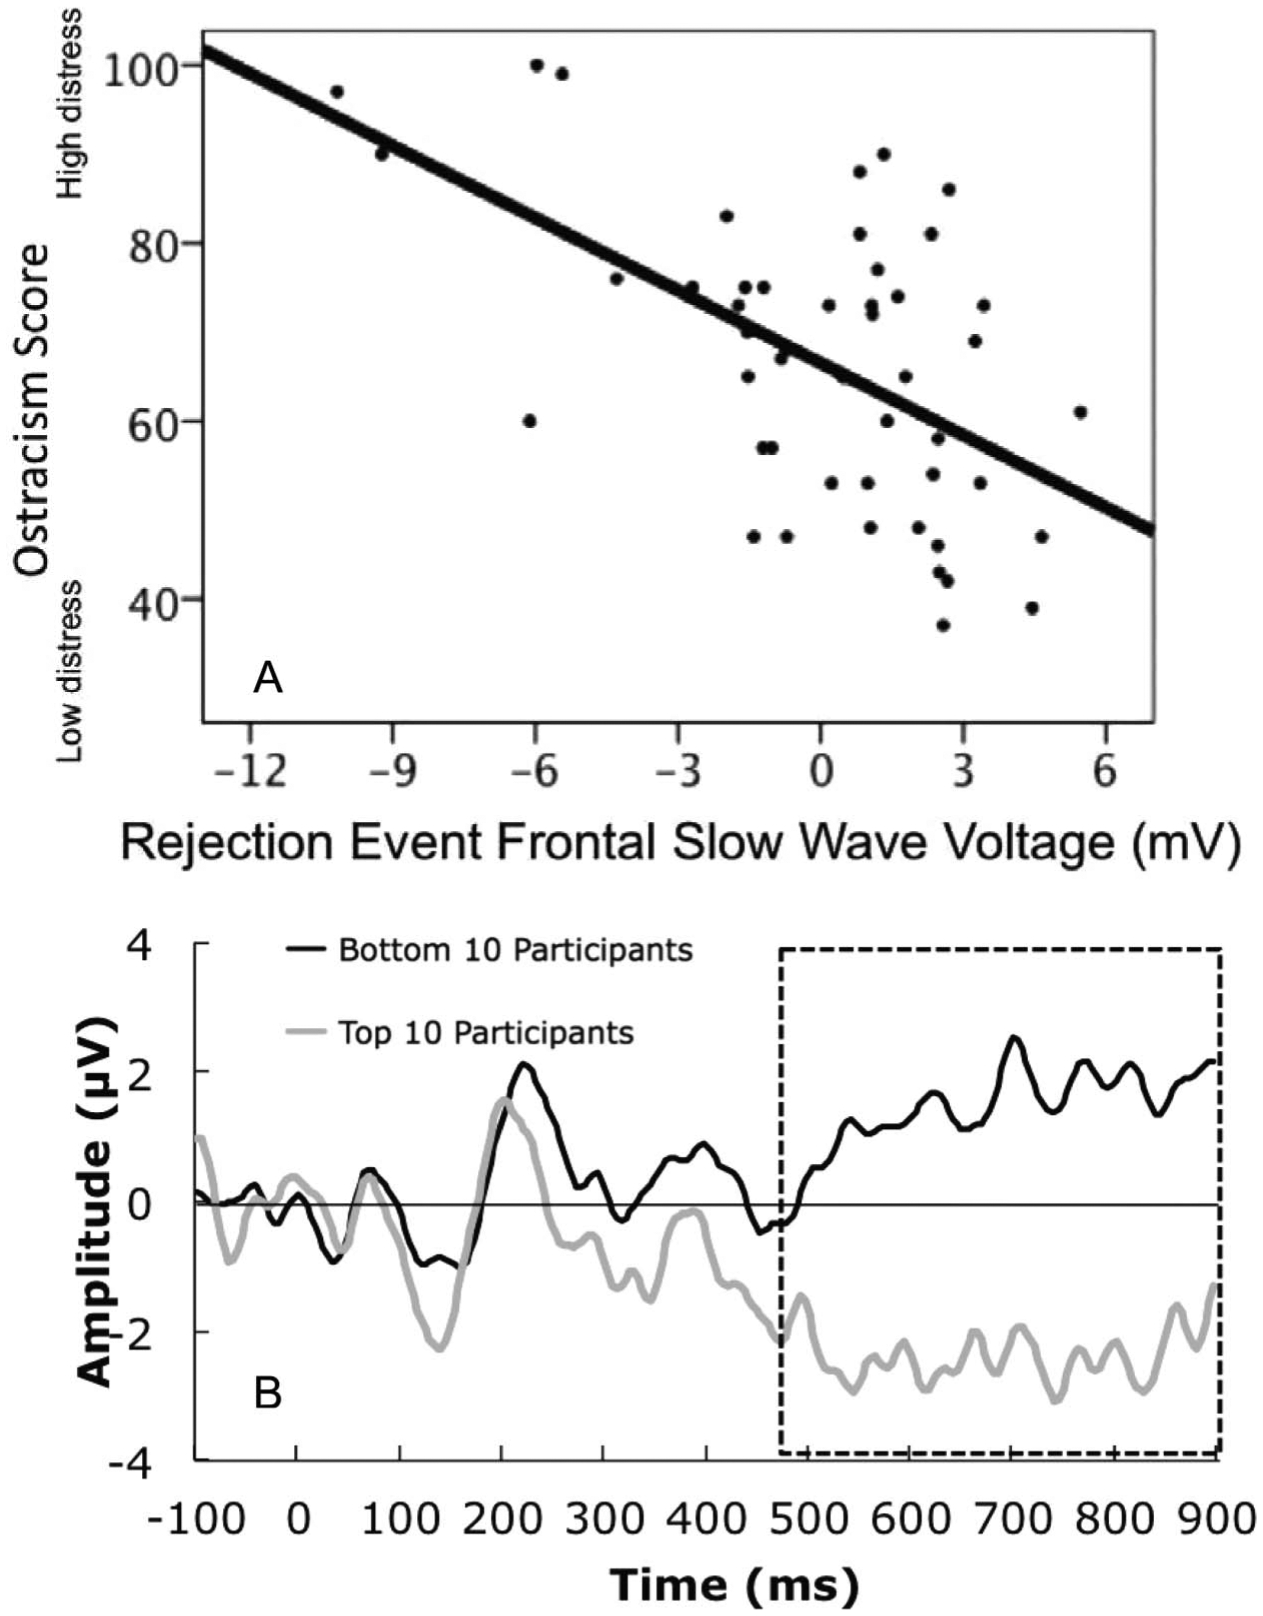
FIGURE 6.

(A) plot of ostracism distress by rejection event frontal slow wave; (B) Plot of event-related potentials (ERPs) for participants with the bottom and top 10 scores for ostracism distress. (Data averaged over frontal channels identified with approach A.)
