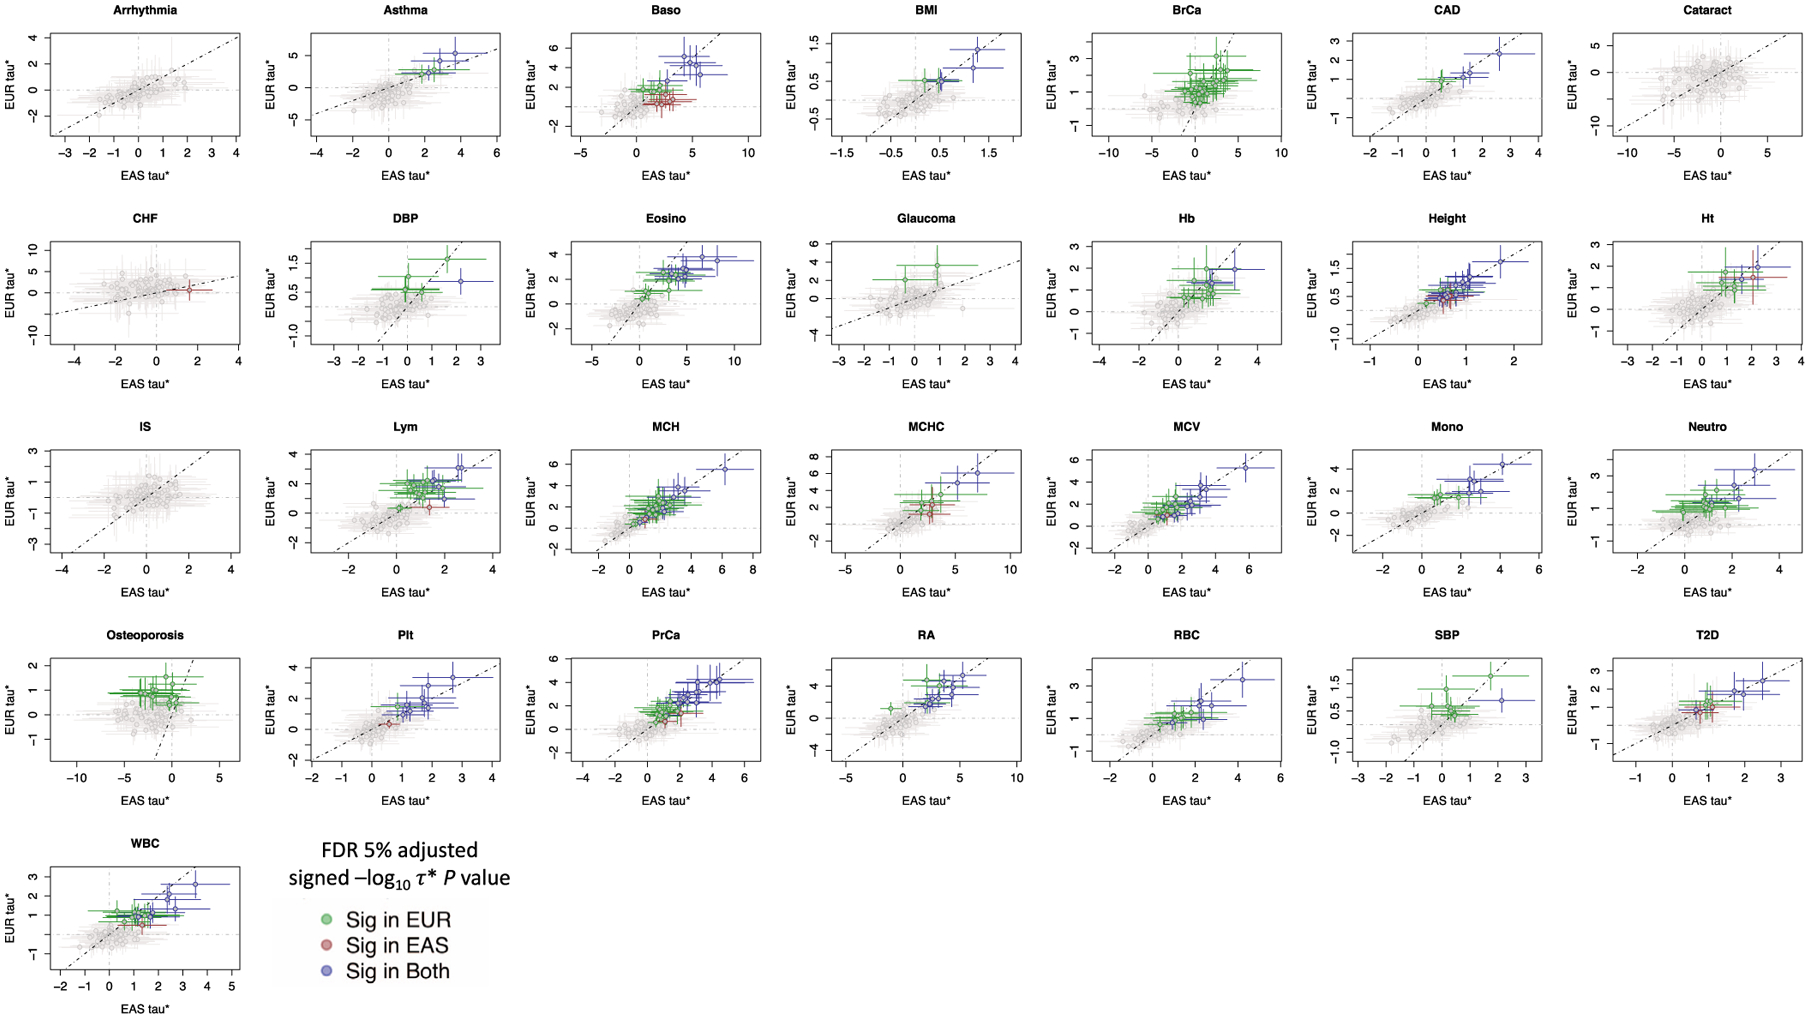
Extended Data Fig. 5 |. Common per-SNP heritability (τ*) estimate for sets of independent IMPACT cell type annotations across 29 traits.

Dotted line is the identity line, y=x. τ* values with their standard errors are colored green if significantly positive in EUR and not EAS, red if significantly positive in EAS but not in EUR, green if significantly positive in both EUR and EAS, and gray if not significantly positive in either population.
