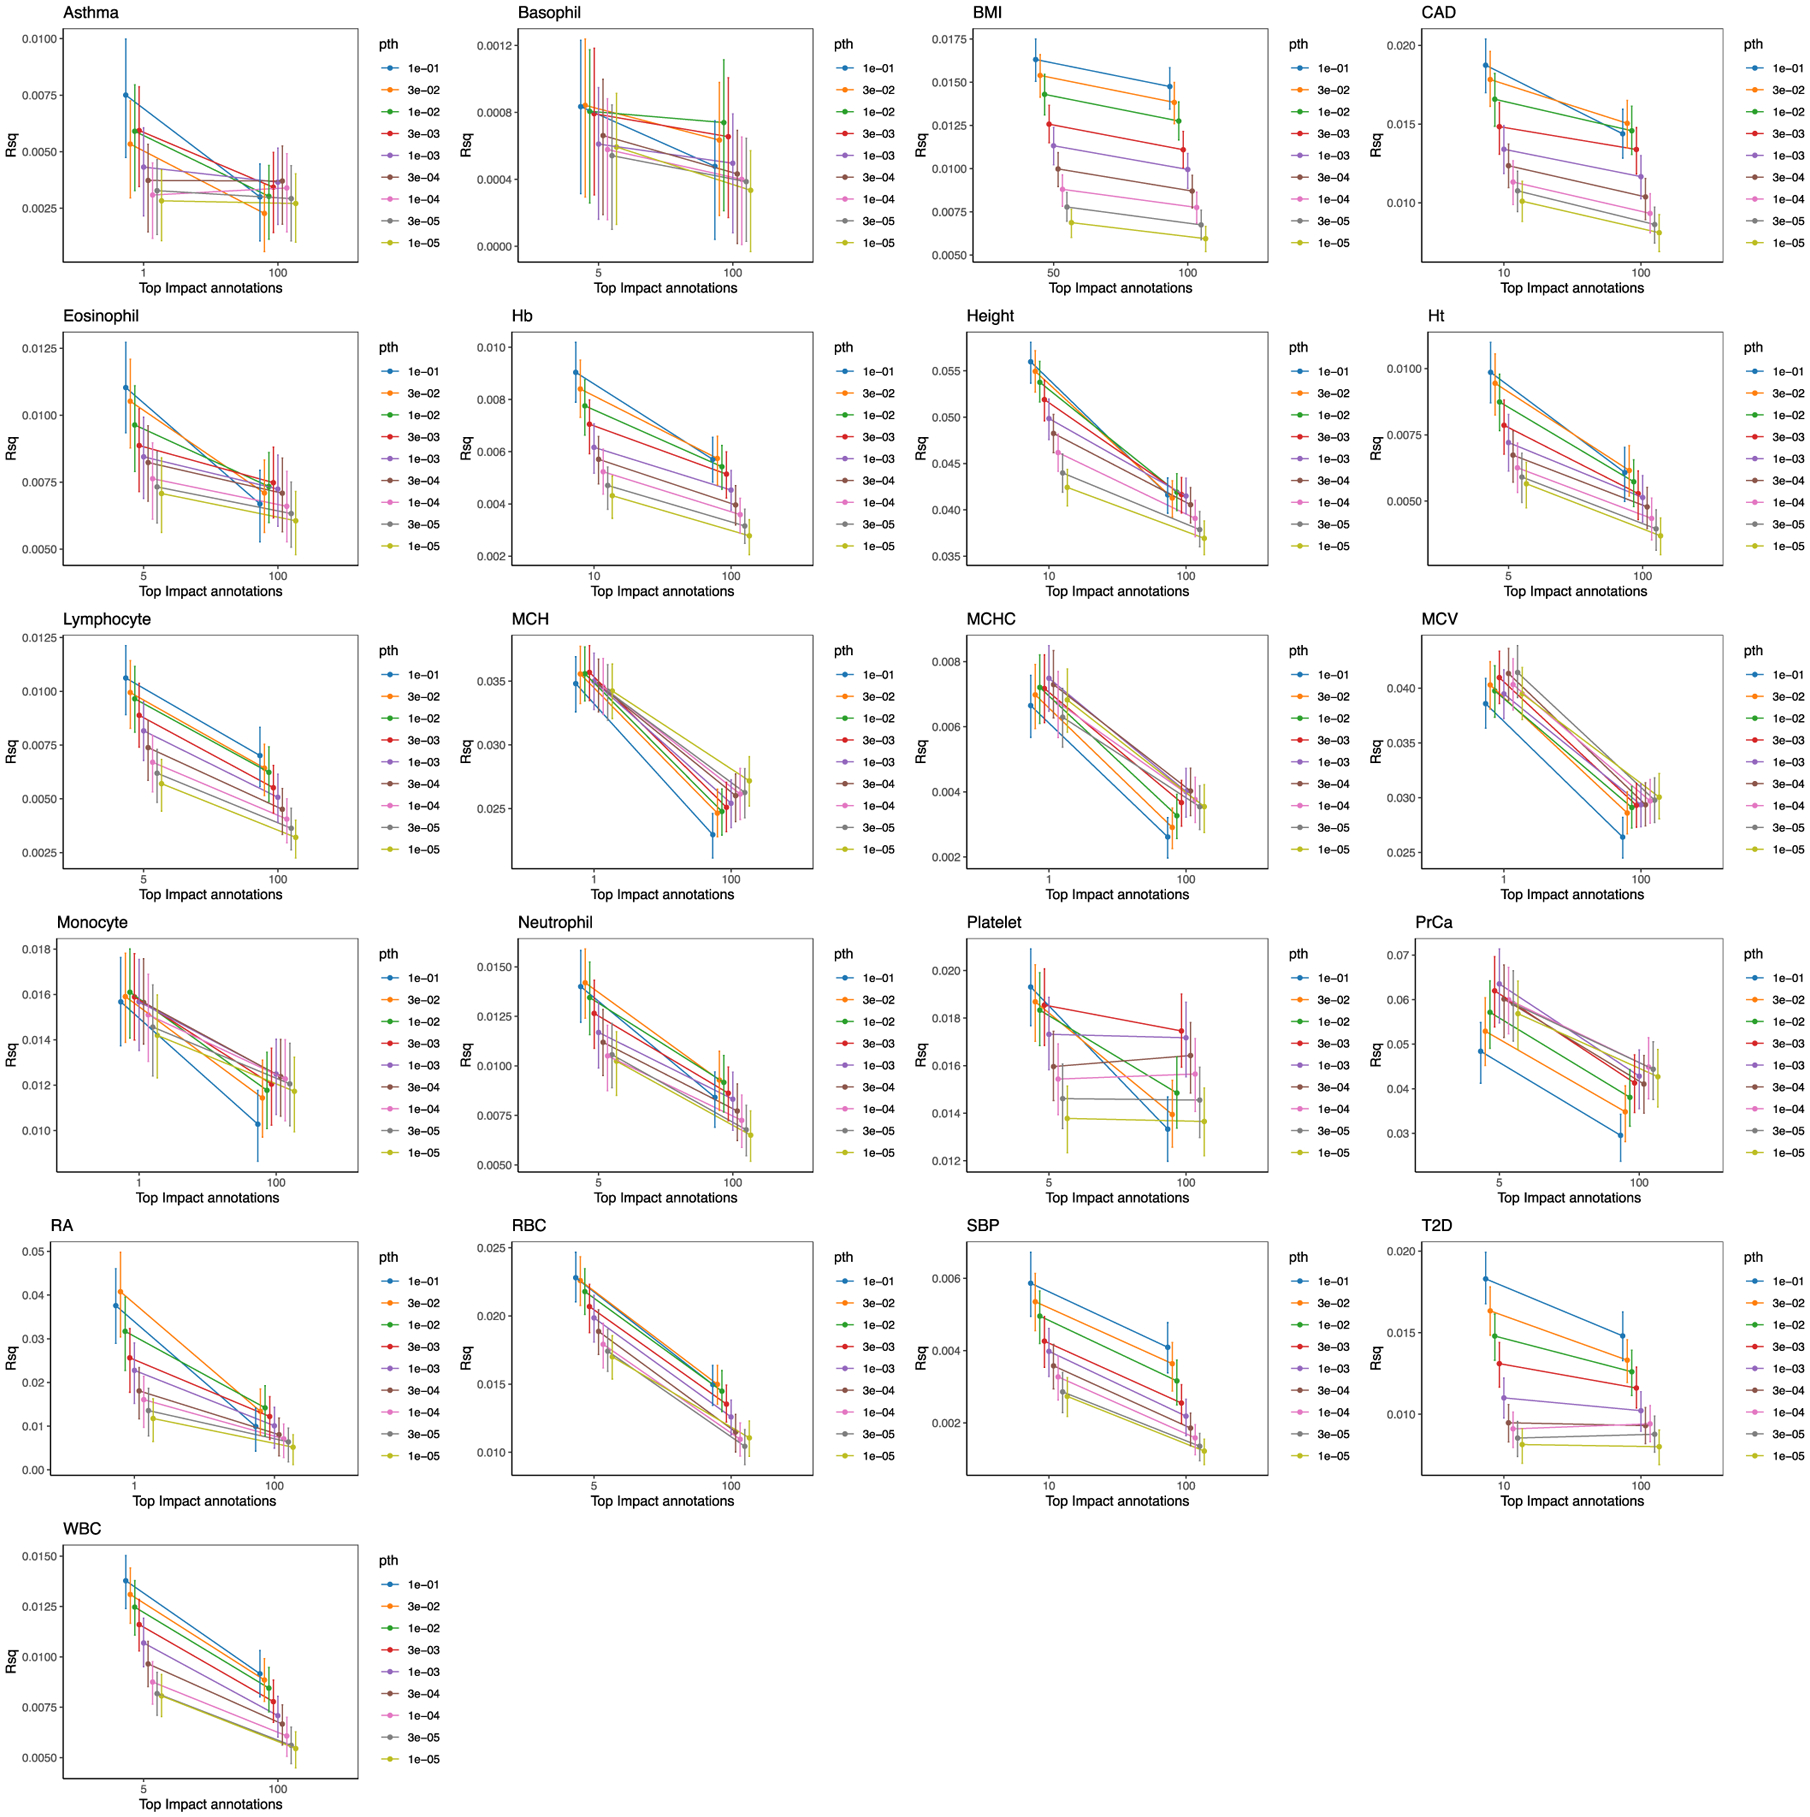
Extended Data Fig. 8 |. EuR PRS model evaluated on EAS individuals from BBJ.

For each trait, we evaluate the predictive value of standard PRS models (top 100% of IMPACT SNPs) and functionally informed PRS models (using a subset of SNPs prioritized by IMPACT). The top 100% of SNPs according to IMPACT represents the PRS model with no functional annotation information. Intervals represent the 95% CI around the R2 estimate. For quantitative traits, R2 represents the proportion of variance captured by the linear PRS model. For case–control traits, R2 represents the liability scale R2 from the logistic regression PRS model.
