
Fig. 2 |. IMPACT annotates relevant cell-type-specific regulatory elements.
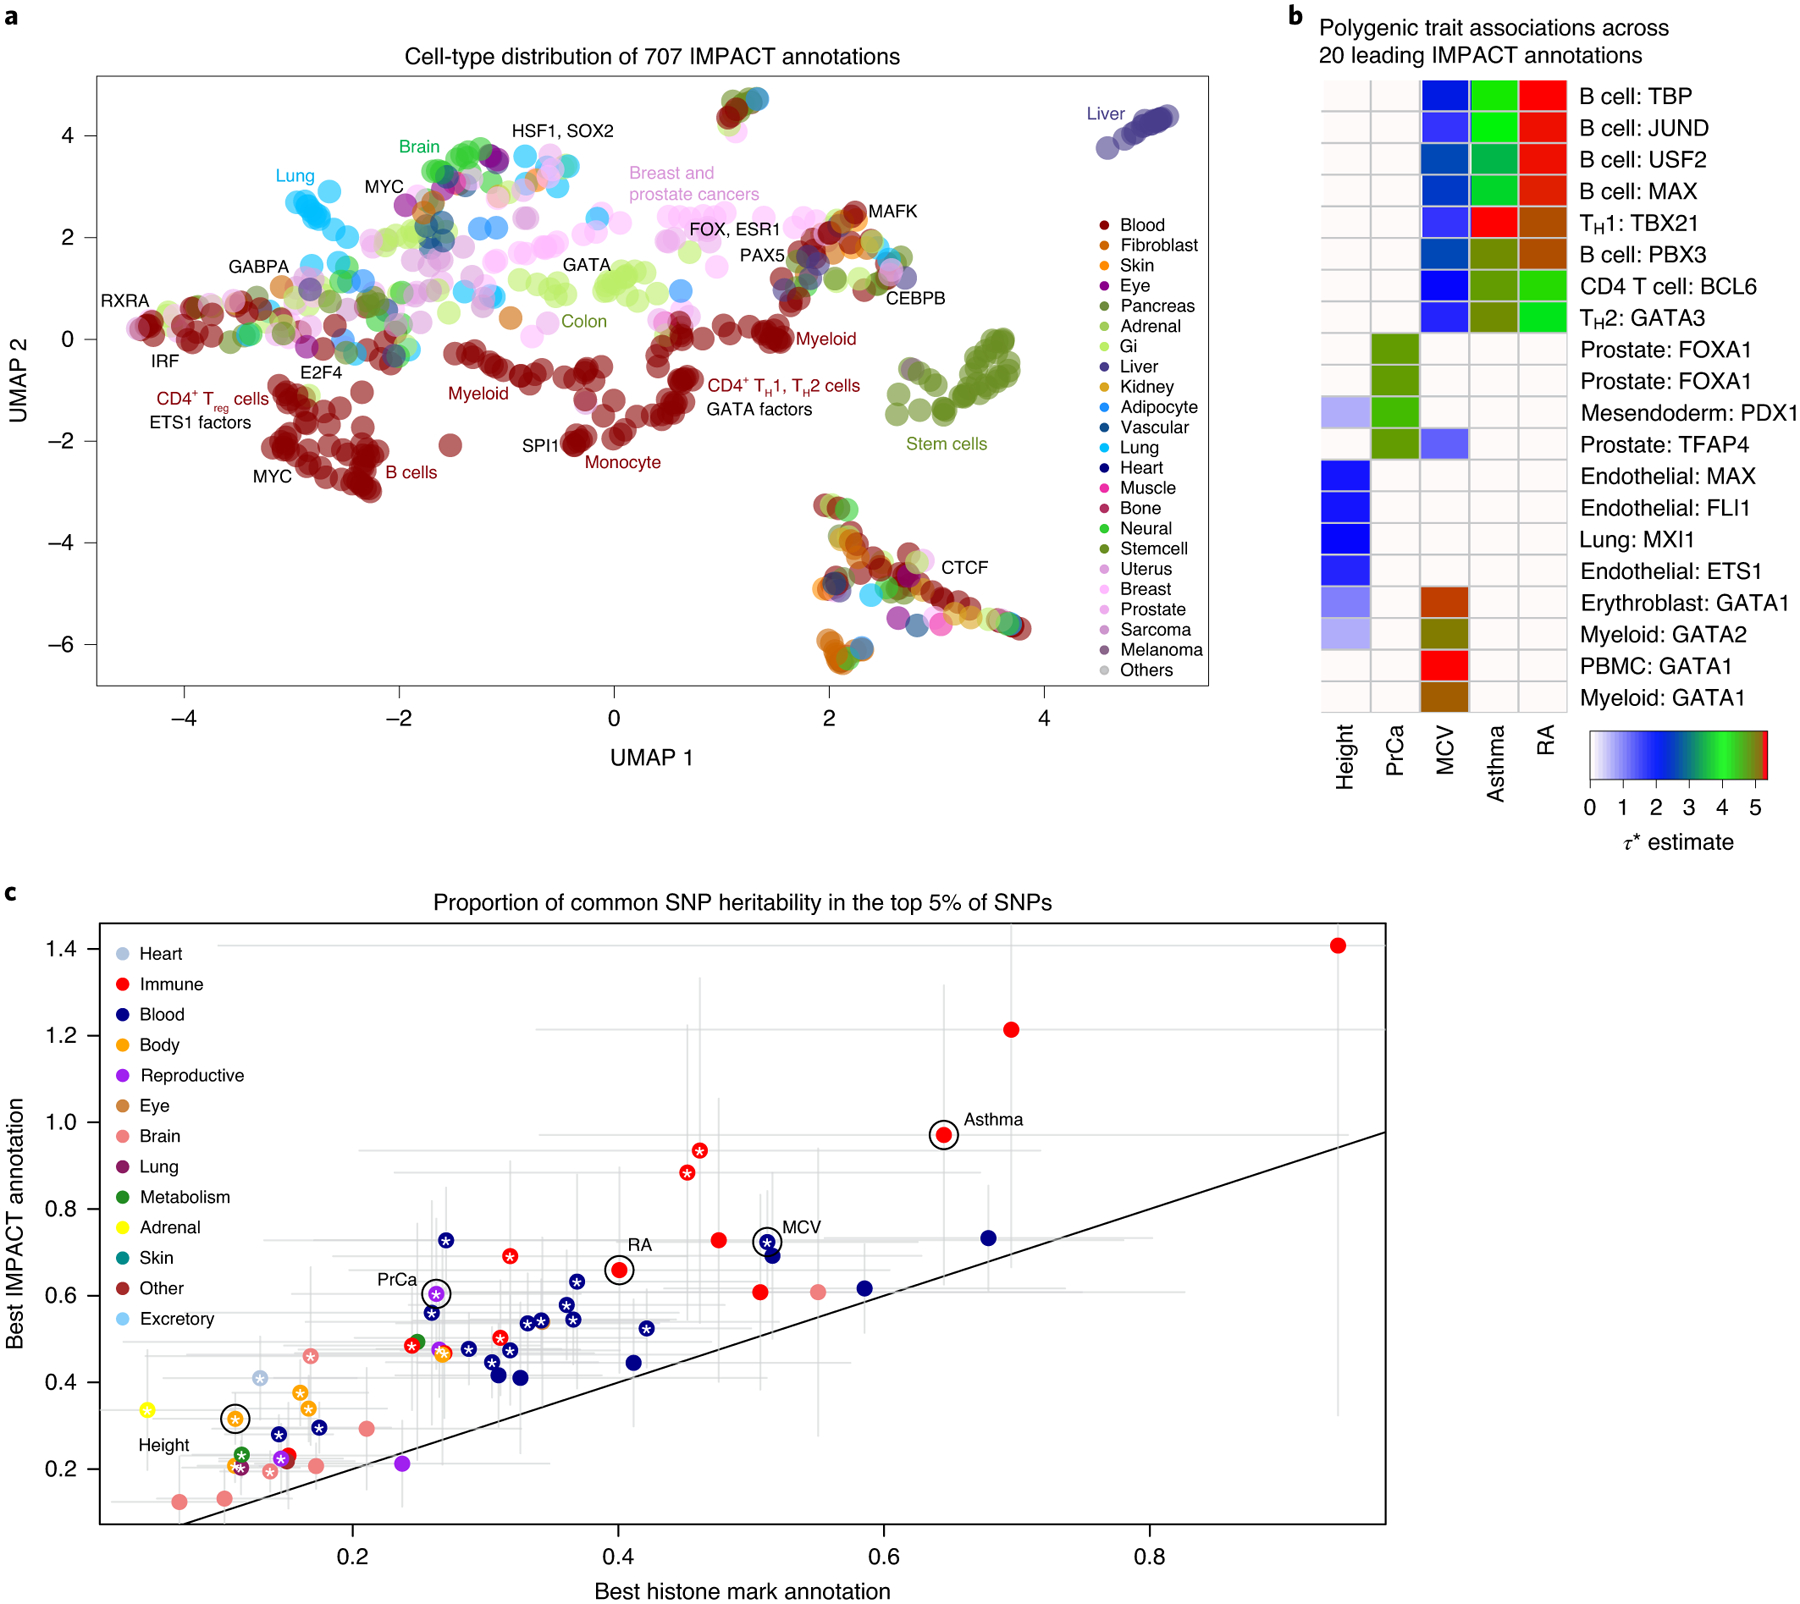
a, Low-dimensional embedding and clustering of 707 IMPACT annotations using uniform manifold approximation projection (UMAP). Annotations colored by cell-type category; TF groups indicated where applicable. b, Biologically distinct regulatory modules revealed by cell type–trait associations with significantly nonzero τ*. Shown here are the 5 representative EUR complex traits and the 4 leading IMPACT annotations for each, resulting in 20 IMPACT annotations highlighted from 707 in total. Color indicates τ* value. c, Lead IMPACT annotations capture more heritability than lead cell-type-specific histone modifications across 60 of 69 EUR summary statistics for which a lead IMPACT annotation was identified. The asterisk indicates the proportion-of-heritability-estimate difference of means P < 0.05. Gray segments indicate the 95% CI around the proportion-of-heritability estimate.