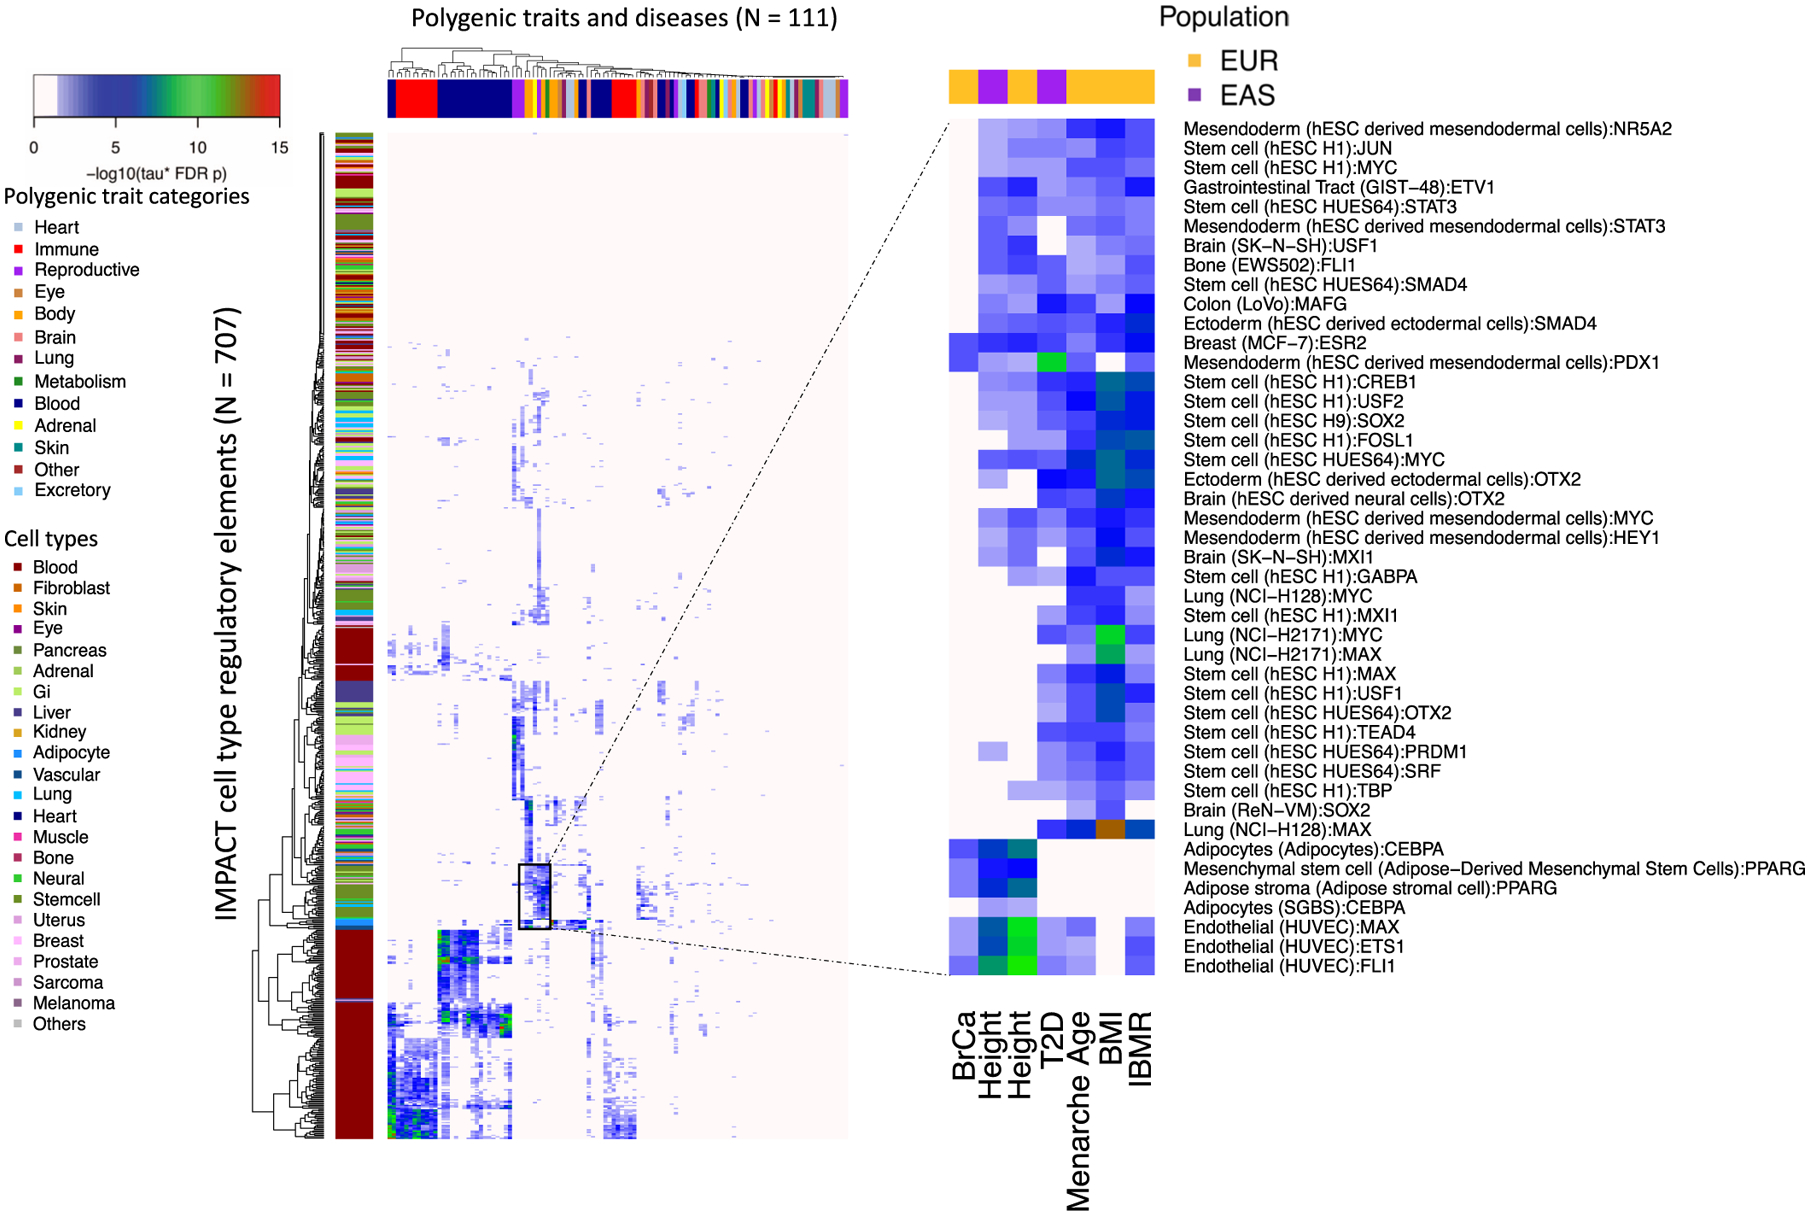
Extended Data Fig. 2 |. IMPACT annotation-trait associations.

Significant cell type-phenotype associations across 707 IMPACT regulatory annotations and 111 complex traits and diseases at τ* 5% FDR, color indicates −log10 FDR 5% adjusted P value of τ*. Zooms shows particular cell type categories enriched for polygenic trait associations.
